Wells Fargo 2014 Annual Report Download - page 47
Download and view the complete annual report
Please find page 47 of the 2014 Wells Fargo annual report below. You can navigate through the pages in the report by either clicking on the pages listed below, or by using the keyword search tool below to find specific information within the annual report.-
 1
1 -
2
-
3
-
4
-
5
-
6
-
7
-
8
-
9
-
10
-
11
-
12
-
13
-
14
-
15
-
16
-
17
-
18
-
19
-
20
-
21
-
22
-
23
-
24
-
25
-
26
-
27
-
28
-
29
-
30
-
31
-
32
-
33
-
34
-
35
-
36
-
 37
37 -
 38
38 -
 39
39 -
 40
40 -
 41
41 -
 42
42 -
 43
43 -
 44
44 -
 45
45 -
 46
46 -
 47
47 -
 48
48 -
 49
49 -
 50
50 -
 51
51 -
 52
52 -
 53
53 -
 54
54 -
 55
55 -
 56
56 -
 57
57 -
58
-
59
-
60
-
61
-
62
-
63
-
64
-
65
-
66
-
67
-
68
-
69
-
70
-
71
-
72
-
73
-
74
-
75
-
76
-
77
-
78
-
79
-
80
-
81
-
82
-
83
-
84
-
85
-
86
-
87
-
88
-
89
-
90
-
91
-
92
-
93
-
94
-
95
-
96
-
97
-
98
-
99
-
100
-
101
-
102
-
103
-
104
-
105
-
106
-
107
-
108
-
109
-
110
-
111
-
112
-
113
-
114
-
115
-
116
-
117
-
118
-
119
-
120
-
121
-
122
-
123
-
124
-
125
-
126
-
127
-
128
-
129
-
130
-
131
-
132
-
133
-
134
-
135
-
136
-
137
-
138
-
139
-
140
-
141
-
142
-
143
-
144
-
145
-
146
-
147
-
148
-
149
-
150
-
151
-
152
-
153
-
154
-
155
-
156
-
157
-
158
-
159
-
160
-
161
-
162
-
163
-
164
-
165
-
166
-
167
-
168
-
169
-
170
-
171
-
172
-
173
-
174
-
175
-
176
-
177
-
178
-
179
-
180
-
181
-
182
-
183
-
184
-
185
-
186
-
187
-
188
-
189
-
190
-
191
-
192
-
193
-
194
-
195
-
196
-
197
-
198
-
199
-
200
-
201
-
202
-
203
-
204
-
205
-
206
-
207
-
208
-
209
-
210
-
211
-
212
-
213
-
214
-
215
-
216
-
217
-
218
-
219
-
220
-
221
-
222
-
223
-
224
-
225
-
226
-
227
-
228
-
229
-
230
-
231
-
232
-
233
-
234
-
235
-
236
-
237
-
238
-
239
-
240
-
241
-
242
-
243
-
244
-
245
-
246
-
247
-
248
-
249
-
250
-
251
-
252
-
253
-
254
-
255
-
256
-
257
-
258
-
259
-
260
-
261
-
262
-
263
-
264
-
265
-
266
-
267
-
268
 |
 |

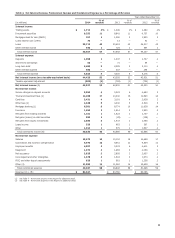
Operating Segment Results
The following discussion provides a description of each of our
operating segments, including cross-sell metrics and financial
results.
COMMUNITY BANKING offers a complete line of diversified
financial products and services for consumers and small
businesses including checking and savings accounts, credit and
debit cards, and auto, student, and small business lending. These
products also include investment, insurance and trust services in
39 states and D.C., and mortgage and home equity loans in all 50
states and D.C. through its Regional Banking and Wells Fargo
Home Lending business units. The Community Banking
segment also includes the results of our Corporate Treasury
activities net of allocations in support of the other operating
segments and results of investments in our affiliated venture
Table 9a - Community Banking
capital partnerships. Our retail banking household cross-sell was
6.17 products per household in November 2014, up from 6.16 in
November 2013 and 6.05 in November 2012. The November
2014 cross-sell ratio included the acquisition of an existing
private label and co-branded credit card loan portfolio in
connection with a new program agreement with Dillard's, Inc.
(Dillard's), a major retail department store. We believe there is
more opportunity for cross-sell as we continue to earn more
business from our customers. Our goal is eight products per
household, which is approximately one-half of our estimate of
potential demand for an average U.S. household. In November
2014, one of every four of our retail banking households had
eight or more of our products. Table 9a provides additional
financial information for Community Banking.
Year ended December 31,
(in millions, except average balances which are in billions) 2014 2013 2012
Net interest income $ 29,709 28,839 29,045
Noninterest income:
Service charges on deposit accounts 3,386 3,463 3,298
Trust and investment fees:
Brokerage advisory, commissions and other fees 1,796 1,603 1,401
Trust and investment management 817 755 699
Investment banking (1) (80) (77) (41)
Total trust and investment fees 2,533 2,281 2,059
Card fees 3,167 2,958 2,638
Other fees 2,296 2,342 2,294
Mortgage banking 6,011 8,335 11,235
Insurance 127 130 147
Net gains from trading activities 134 244 133
Net gains (losses) on debt securities 253 (77) (120)
Net gains from equity investments (2) 1,731 1,033 875
Other income of the segment 1,515 791 1,801
Total noninterest income 21,153 21,500 24,360
Total revenue 50,862 50,339 53,405
Provision for credit losses 1,681 2,755 6,835
Noninterest expense:
Personnel expense 17,077 17,693 17,195
Equipment 1,740 1,733 1,759
Net occupancy 2,181 2,133 2,093
Core deposit and other intangibles 629 697 781
FDIC and other deposit assessments 584 621 907
Outside professional services 1,124 1,117 1,311
Operating losses 1,065 698 2,029
Other expense of the segment 3,726 4,031 4,765
Total noninterest expense 28,126 28,723 30,840
Income before income tax expense and noncontrolling interests 21,055 18,861 15,730
Income tax expense 6,350 5,799 4,774
Net income from noncontrolling interests (3) 525 330 464
Net income $ 14,180 12,732 10,492
Average loans $ 503.2 499.3 487.1
Average core deposits 642.3 620.1 591.2
(1) Represents syndication and underwriting fees paid to Wells Fargo Securities which are offset in our Wholesale Banking segment.
(2) Predominantly represents gains resulting from venture capital investments.
(3) Reflects results attributable to noncontrolling interests primarily associated with the Company’s consolidated merchant services joint venture and venture capital
investments.
45