Wells Fargo 2014 Annual Report Download - page 159
Download and view the complete annual report
Please find page 159 of the 2014 Wells Fargo annual report below. You can navigate through the pages in the report by either clicking on the pages listed below, or by using the keyword search tool below to find specific information within the annual report.-
 1
1 -
2
-
3
-
4
-
5
-
6
-
7
-
8
-
9
-
10
-
11
-
12
-
13
-
14
-
15
-
16
-
17
-
18
-
19
-
20
-
21
-
22
-
23
-
24
-
25
-
26
-
27
-
28
-
29
-
30
-
31
-
32
-
33
-
34
-
35
-
36
-
37
-
38
-
39
-
40
-
41
-
42
-
43
-
44
-
45
-
46
-
47
-
48
-
49
-
50
-
51
-
52
-
53
-
54
-
55
-
56
-
57
-
58
-
59
-
60
-
61
-
62
-
63
-
64
-
65
-
66
-
67
-
68
-
69
-
70
-
71
-
72
-
73
-
74
-
75
-
76
-
77
-
78
-
79
-
80
-
81
-
82
-
83
-
84
-
85
-
86
-
87
-
88
-
89
-
90
-
91
-
92
-
93
-
94
-
95
-
96
-
97
-
98
-
99
-
100
-
101
-
102
-
103
-
104
-
105
-
106
-
107
-
108
-
109
-
110
-
111
-
112
-
113
-
114
-
115
-
116
-
117
-
118
-
119
-
120
-
121
-
122
-
123
-
124
-
125
-
126
-
127
-
128
-
129
-
130
-
131
-
132
-
133
-
134
-
135
-
136
-
137
-
138
-
139
-
140
-
141
-
142
-
143
-
144
-
145
-
146
-
147
-
148
-
 149
149 -
 150
150 -
 151
151 -
 152
152 -
 153
153 -
 154
154 -
 155
155 -
 156
156 -
 157
157 -
 158
158 -
 159
159 -
 160
160 -
 161
161 -
 162
162 -
 163
163 -
 164
164 -
 165
165 -
 166
166 -
 167
167 -
 168
168 -
 169
169 -
170
-
171
-
172
-
173
-
174
-
175
-
176
-
177
-
178
-
179
-
180
-
181
-
182
-
183
-
184
-
185
-
186
-
187
-
188
-
189
-
190
-
191
-
192
-
193
-
194
-
195
-
196
-
197
-
198
-
199
-
200
-
201
-
202
-
203
-
204
-
205
-
206
-
207
-
208
-
209
-
210
-
211
-
212
-
213
-
214
-
215
-
216
-
217
-
218
-
219
-
220
-
221
-
222
-
223
-
224
-
225
-
226
-
227
-
228
-
229
-
230
-
231
-
232
-
233
-
234
-
235
-
236
-
237
-
238
-
239
-
240
-
241
-
242
-
243
-
244
-
245
-
246
-
247
-
248
-
249
-
250
-
251
-
252
-
253
-
254
-
255
-
256
-
257
-
258
-
259
-
260
-
261
-
262
-
263
-
264
-
265
-
266
-
267
-
268
 |
 |
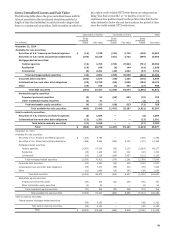
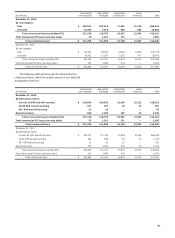
The following table shows the amortized cost and weighted-
average yields of held-to-maturity debt securities by contractual
maturity.
Remaining contractual maturity
(in millions)
December 31, 2014
Total
amount Yield
Within one year
Amount Yield
After one year
through five years
Amount Yield
After five years
through ten years
Amount Yield
After ten years
Amount Yield
Held-to-maturity securities (1):
Amortized cost:
Securities of U.S. Treasury and
federal agencies $ 40,886 2.12% $ — —% $ — —% $ 40,886 2.12% $ — —%
Securities of U.S. states and
political subdivisions
Federal agency mortgage-backed
securities
1,962
5,476
5.60
3.89
—
—
—
—
—
—
—
—
9
—
6.60
—
1,953
5,476
5.59
3.89
Collateralized loan and other debt
obligations
Other
1,404
5,755
1.96
1.64
—
192
—
1.61
—
4,214
—
1.72
—
1,349
—
1.41
1,404
—
1.96
—
Total held-to-maturity debt
securities at amortized cost $ 55,483 2.37% $ 192 1.61% $ 4,214 1.72% $ 42,244 2.10% $ 8,833 3.96%
December 31, 2013
Held-to-maturity securities (1):
Amortized cost:
Federal agency mortgage-backed
securities $ 6,304 3.90 % $ — — % $ — — % $ — — % $ 6,304 3.90 %
Other 6,042 1.89 195 1.72 4,468 1.87 1,379 1.98 — —
Total held-to-maturity debt
securities at amortized cost $ 12,346 2.92 % $ 195 1.72 % $ 4,468 1.87 % $ 1,379 1.98 % $ 6,304 3.90 %
(1) Weighted-average yields displayed by maturity bucket are weighted based on amortized cost and predominantly represent contractual coupon rates.
The following table shows the fair value of held-to-maturity
debt securities by contractual maturity.
Remaining contractual maturity
(in millions)
December 31, 2014
Total
amount
Within one year
Amount
After one year
through five years
Amount
After five years
through ten years
Amount
After ten years
Amount
Held-to-maturity securities:
Fair value:
Securities of U.S. Treasury and federal
agencies $ 41,548 $ — $ — $ 41,548 $ —
Securities of U.S. states and political
subdivisions 1,989 — — 9 1,980
Federal agency mortgage-backed
securities 5,641 — — — 5,641
Collateralized loan and other debt
obligations
Other
1,391
5,790
—
193
—
4,239
—
1,358
1,391
—
Total held-to-maturity debt
securities at fair value $ 56,359 $ 193 $ 4,239 $ 42,915 $ 9,012
December 31, 2013
Held-to-maturity securities:
Fair Value:
Federal agency mortgage-backed
securities $ 6,205 $ — $ — $ — $ 6,205
Other 6,042 195 4,468 1,379 —
Total held-to-maturity debt securities at
fair value $ 12,247 $ 195 $ 4,468 $ 1,379 $ 6,205
157