Wells Fargo 2014 Annual Report Download - page 61
Download and view the complete annual report
Please find page 61 of the 2014 Wells Fargo annual report below. You can navigate through the pages in the report by either clicking on the pages listed below, or by using the keyword search tool below to find specific information within the annual report.-
 1
1 -
2
-
3
-
4
-
5
-
6
-
7
-
8
-
9
-
10
-
11
-
12
-
13
-
14
-
15
-
16
-
17
-
18
-
19
-
20
-
21
-
22
-
23
-
24
-
25
-
26
-
27
-
28
-
29
-
30
-
31
-
32
-
33
-
34
-
35
-
36
-
37
-
38
-
39
-
40
-
41
-
42
-
43
-
44
-
45
-
46
-
47
-
48
-
49
-
50
-
 51
51 -
 52
52 -
 53
53 -
 54
54 -
 55
55 -
 56
56 -
 57
57 -
 58
58 -
 59
59 -
 60
60 -
 61
61 -
 62
62 -
 63
63 -
 64
64 -
 65
65 -
 66
66 -
 67
67 -
 68
68 -
 69
69 -
 70
70 -
 71
71 -
72
-
73
-
74
-
75
-
76
-
77
-
78
-
79
-
80
-
81
-
82
-
83
-
84
-
85
-
86
-
87
-
88
-
89
-
90
-
91
-
92
-
93
-
94
-
95
-
96
-
97
-
98
-
99
-
100
-
101
-
102
-
103
-
104
-
105
-
106
-
107
-
108
-
109
-
110
-
111
-
112
-
113
-
114
-
115
-
116
-
117
-
118
-
119
-
120
-
121
-
122
-
123
-
124
-
125
-
126
-
127
-
128
-
129
-
130
-
131
-
132
-
133
-
134
-
135
-
136
-
137
-
138
-
139
-
140
-
141
-
142
-
143
-
144
-
145
-
146
-
147
-
148
-
149
-
150
-
151
-
152
-
153
-
154
-
155
-
156
-
157
-
158
-
159
-
160
-
161
-
162
-
163
-
164
-
165
-
166
-
167
-
168
-
169
-
170
-
171
-
172
-
173
-
174
-
175
-
176
-
177
-
178
-
179
-
180
-
181
-
182
-
183
-
184
-
185
-
186
-
187
-
188
-
189
-
190
-
191
-
192
-
193
-
194
-
195
-
196
-
197
-
198
-
199
-
200
-
201
-
202
-
203
-
204
-
205
-
206
-
207
-
208
-
209
-
210
-
211
-
212
-
213
-
214
-
215
-
216
-
217
-
218
-
219
-
220
-
221
-
222
-
223
-
224
-
225
-
226
-
227
-
228
-
229
-
230
-
231
-
232
-
233
-
234
-
235
-
236
-
237
-
238
-
239
-
240
-
241
-
242
-
243
-
244
-
245
-
246
-
247
-
248
-
249
-
250
-
251
-
252
-
253
-
254
-
255
-
256
-
257
-
258
-
259
-
260
-
261
-
262
-
263
-
264
-
265
-
266
-
267
-
268
 |
 |

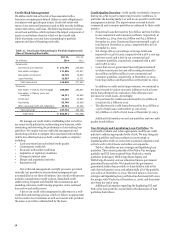
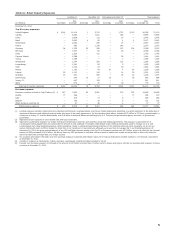
Table 17: Non-Strategic and Liquidating Loan Portfolios
Outstanding balance
Dec 31, Dec 31, Dec 31,
(in millions) 2014 2013 2008
Commercial:
Legacy Wachovia commercial and industrial and commercial real estate PCI loans (1) $ 1,125 2,013 18,704
Total commercial 1,125 2,013 18,704
Consumer:
Pick-a-Pay mortgage (1)(2) 45,002 50,971 95,315
Legacy Wells Fargo Financial debt consolidation 11,417 12,893 25,299
Liquidating home equity 2,910 3,695 10,309
Legacy Wachovia other PCI loans (1) 300 375 2,478
Legacy Wells Fargo Financial indirect auto 34 207 18,221
Education Finance - government insured (3) — 10,712 20,465
Total consumer 59,663 78,853 172,087
Total non-strategic and liquidating loan portfolios $ 60,788 80,866 190,791
(1) Net of purchase accounting adjustments related to PCI loans.
(2) Includes PCI loans of $21.5 billion, $23.8 billion and $37.6 billion at December 31, 2014, 2013 and 2008, respectively.
(3) The government guaranteed student loan portfolio was transferred to held for sale during 2014, and substantially all of the portfolio was sold as of December 31, 2014.
PURCHASED CREDIT-IMPAIRED (PCI) LOANS Loans
acquired with evidence of credit deterioration since their
origination and where it is probable that we will not collect all
contractually required principal and interest payments are PCI
loans. Substantially all of our PCI loans were acquired in the
Wachovia acquisition on December 31, 2008. PCI loans are
recorded at fair value at the date of acquisition, and the
historical allowance for credit losses related to these loans is not
carried over. The carrying value of PCI loans totaled
$23.3 billion at December 31, 2014, down from $26.7 billion and
$58.8 billion at December 31, 2013 and 2008, respectively. Such
loans are considered to be accruing due to the existence of the
accretable yield and not based on consideration given to
contractual interest payments. The accretable yield at
December 31, 2014, was $17.8 billion.
A nonaccretable difference is established for PCI loans to
absorb losses expected on those loans at the date of acquisition.
Amounts absorbed by the nonaccretable difference do not affect
the income statement or the allowance for credit losses.
Substantially all commercial and industrial and commercial
real estate (CRE) PCI loans are accounted for as individual loans.
Conversely, Pick-a-Pay and other consumer PCI loans have been
aggregated into pools based on common risk characteristics.
Each pool is accounted for as a single asset with a single
composite interest rate and an aggregate expectation of cash
flows.
Resolutions of loans may include sales to third parties,
receipt of payments in settlement with the borrower, or
foreclosure of the collateral. Our policy is to remove an
individual PCI loan from a pool based on comparing the amount
received from its resolution with its contractual amount. Any
difference between these amounts is absorbed by the
nonaccretable difference. This removal method assumes that the
amount received from resolution approximates pool
performance expectations. The accretable yield percentage is
unaffected by the resolution and any changes in the effective
yield for the remaining loans in the pool are addressed by our
quarterly cash flow evaluation process for each pool. For loans
that are resolved by payment in full, there is no release of the
nonaccretable difference for the pool because there is no
difference between the amount received at resolution and the
contractual amount of the loan. Modified PCI loans are not
removed from a pool even if those loans would otherwise be
deemed TDRs. Modified PCI loans that are accounted for
individually are TDRs, and removed from PCI accounting, if
there has been a concession granted in excess of the original
nonaccretable difference. We include these TDRs in our
impaired loans.
During 2014, we recognized as income $61 million released
from the nonaccretable difference related to commercial PCI
loans due to payoffs and other resolutions. We also transferred
$2.2 billion from the nonaccretable difference to the accretable
yield for PCI loans with improving credit-related cash flows and
recognized $31 million for recoveries of previous write-downs.
Our cash flows expected to be collected have been favorably
affected by lower than expected defaults and losses as a result of
observed economic strengthening, particularly in housing prices,
and by our loan modification efforts. Table 18 provides an
analysis of changes in the nonaccretable difference.
59