Wells Fargo 2014 Annual Report Download - page 213
Download and view the complete annual report
Please find page 213 of the 2014 Wells Fargo annual report below. You can navigate through the pages in the report by either clicking on the pages listed below, or by using the keyword search tool below to find specific information within the annual report.-
 1
1 -
2
-
3
-
4
-
5
-
6
-
7
-
8
-
9
-
10
-
11
-
12
-
13
-
14
-
15
-
16
-
17
-
18
-
19
-
20
-
21
-
22
-
23
-
24
-
25
-
26
-
27
-
28
-
29
-
30
-
31
-
32
-
33
-
34
-
35
-
36
-
37
-
38
-
39
-
40
-
41
-
42
-
43
-
44
-
45
-
46
-
47
-
48
-
49
-
50
-
51
-
52
-
53
-
54
-
55
-
56
-
57
-
58
-
59
-
60
-
61
-
62
-
63
-
64
-
65
-
66
-
67
-
68
-
69
-
70
-
71
-
72
-
73
-
74
-
75
-
76
-
77
-
78
-
79
-
80
-
81
-
82
-
83
-
84
-
85
-
86
-
87
-
88
-
89
-
90
-
91
-
92
-
93
-
94
-
95
-
96
-
97
-
98
-
99
-
100
-
101
-
102
-
103
-
104
-
105
-
106
-
107
-
108
-
109
-
110
-
111
-
112
-
113
-
114
-
115
-
116
-
117
-
118
-
119
-
120
-
121
-
122
-
123
-
124
-
125
-
126
-
127
-
128
-
129
-
130
-
131
-
132
-
133
-
134
-
135
-
136
-
137
-
138
-
139
-
140
-
141
-
142
-
143
-
144
-
145
-
146
-
147
-
148
-
149
-
150
-
151
-
152
-
153
-
154
-
155
-
156
-
157
-
158
-
159
-
160
-
161
-
162
-
163
-
164
-
165
-
166
-
167
-
168
-
169
-
170
-
171
-
172
-
173
-
174
-
175
-
176
-
177
-
178
-
179
-
180
-
181
-
182
-
183
-
184
-
185
-
186
-
187
-
188
-
189
-
190
-
191
-
192
-
193
-
194
-
195
-
196
-
197
-
198
-
199
-
200
-
201
-
202
-
 203
203 -
 204
204 -
 205
205 -
 206
206 -
 207
207 -
 208
208 -
 209
209 -
 210
210 -
 211
211 -
 212
212 -
 213
213 -
 214
214 -
 215
215 -
 216
216 -
 217
217 -
 218
218 -
 219
219 -
 220
220 -
 221
221 -
 222
222 -
 223
223 -
224
-
225
-
226
-
227
-
228
-
229
-
230
-
231
-
232
-
233
-
234
-
235
-
236
-
237
-
238
-
239
-
240
-
241
-
242
-
243
-
244
-
245
-
246
-
247
-
248
-
249
-
250
-
251
-
252
-
253
-
254
-
255
-
256
-
257
-
258
-
259
-
260
-
261
-
262
-
263
-
264
-
265
-
266
-
267
-
268
 |
 |

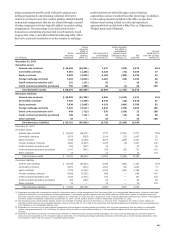
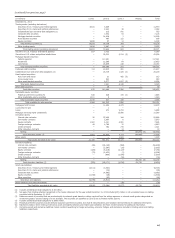
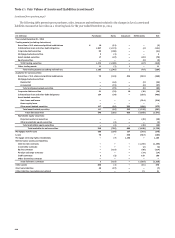
Notional amount
Protection Protection
(in millions) Fair value
liability Protection
sold (A)
sold - non-
investment
grade
purchased with
identical
underlyings (B)
Net
protection
sold (A)-(B)
Other
protection
purchased Range of
maturities
December 31, 2014
Credit default swaps on:
Corporate bonds $ 23 6,344 2,904 4,894 1,450 2,831 2015 - 2021
Structured products 654 1,055 874 608 447 277 2017 - 2052
Credit protection on:
Default swap index — 1,659 292 777 882 1,042 2015 - 2019
Commercial mortgage-backed securities index 246 1,058 — 608 450 355 2047 - 2063
Asset-backed securities index 19 52 1 1 51 81 2045 - 2046
Other 1 2,136 2,136 — 2,136 5,185 2015 - 2025
Total credit derivatives $ 943 12,304 6,207 6,888 5,416 9,771
December 31, 2013
Credit default swaps on:
Corporate bonds $ 48 10,947 5,237 6,493 4,454 5,557 2014-2021
Structured products 1,091 1,553 1,245 894 659 389 2016-2052
Credit protection on:
Default swap index — 3,270 388 2,471 799 898 2014-2018
Commercial mortgage-backed securities index 344 1,106 1 535 571 535 2049-2052
Asset-backed securities index 48 55 — 1 54 87 2045-2046
Other 1 2,570 2,570 3 2,567 5,451 2014-2025
Total credit derivatives $ 1,532 19,501 9,441 10,397 9,104 12,917
Protection sold represents the estimated maximum
exposure to loss that would be incurred under an assumed
hypothetical circumstance, where the value of our interests and
any associated collateral declines to zero, without any
consideration of recovery or offset from any economic hedges.
We believe this hypothetical circumstance to be an extremely
remote possibility and accordingly, this required disclosure is
not an indication of expected loss. The amounts under non-
investment grade represent the notional amounts of those credit
derivatives on which we have a higher risk of being required to
perform under the terms of the credit derivative and are a
function of the underlying assets.
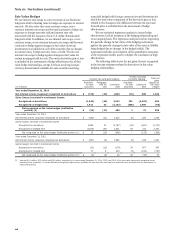
We consider the risk of performance to be high if the
underlying assets under the credit derivative have an external
rating that is below investment grade or an internal credit
default grade that is equivalent thereto. We believe the net
protection sold, which is representative of the net notional
amount of protection sold and purchased with identical
underlyings, in combination with other protection purchased, is
more representative of our exposure to loss than either non-
investment grade or protection sold. Other protection purchased
represents additional protection, which may offset the exposure
to loss for protection sold, that was not purchased with an
identical underlying of the protection sold.
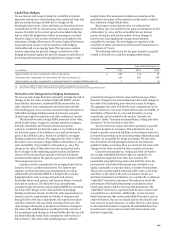
Credit-Risk Contingent Features
Certain of our derivative contracts contain provisions whereby if
the credit rating of our debt were to be downgraded by certain
major credit rating agencies, the counterparty could demand
additional collateral or require termination or replacement of
derivative instruments in a net liability position. The aggregate
fair value of all derivative instruments with such credit-risk-
related contingent features that are in a net liability position was
$13.6 billion at December 31, 2014, and $14.3 billion at
December 31, 2013, respectively, for which we posted
$10.5 billion and $12.2 billion, respectively, in collateral in the
normal course of business. If the credit rating of our debt had
been downgraded below investment grade, which is the credit-
risk-related contingent feature that if triggered requires the
maximum amount of collateral to be posted, on December 31,
2014, or December 31, 2013, we would have been required to
post additional collateral of $3.1 billion or $2.5 billion,
respectively, or potentially settle the contract in an amount equal
to its fair value. Some contracts require that we provide more
collateral than the fair value of derivatives that are in a net
liability position if a downgrade occurs.
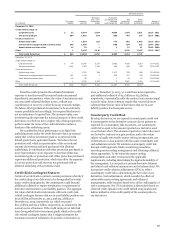
Counterparty Credit Risk
By using derivatives, we are exposed to counterparty credit risk
if counterparties to the derivative contracts do not perform as
expected. If a counterparty fails to perform, our counterparty
credit risk is equal to the amount reported as a derivative asset
on our balance sheet. The amounts reported as a derivative asset
are derivative contracts in a gain position, and to the extent
subject to legally enforceable master netting arrangements, net
of derivatives in a loss position with the same counterparty and
cash collateral received. We minimize counterparty credit risk
through credit approvals, limits, monitoring procedures,
executing master netting arrangements and obtaining collateral,
where appropriate. To the extent the master netting
arrangements and other criteria meet the applicable
requirements, including determining the legal enforceability of
the arrangement, it is our policy to present derivative balances
and related cash collateral amounts net on the balance sheet. We
incorporate credit valuation adjustments (CVA) to reflect
counterparty credit risk in determining the fair value of our
derivatives. Such adjustments, which consider the effects of
enforceable master netting agreements and collateral
arrangements, reflect market-based views of the credit quality of
each counterparty. Our CVA calculation is determined based on
observed credit spreads in the credit default swap market and
indices indicative of the credit quality of the counterparties to
our derivatives.
211