Wells Fargo 2014 Annual Report Download - page 209
Download and view the complete annual report
Please find page 209 of the 2014 Wells Fargo annual report below. You can navigate through the pages in the report by either clicking on the pages listed below, or by using the keyword search tool below to find specific information within the annual report.-
 1
1 -
2
-
3
-
4
-
5
-
6
-
7
-
8
-
9
-
10
-
11
-
12
-
13
-
14
-
15
-
16
-
17
-
18
-
19
-
20
-
21
-
22
-
23
-
24
-
25
-
26
-
27
-
28
-
29
-
30
-
31
-
32
-
33
-
34
-
35
-
36
-
37
-
38
-
39
-
40
-
41
-
42
-
43
-
44
-
45
-
46
-
47
-
48
-
49
-
50
-
51
-
52
-
53
-
54
-
55
-
56
-
57
-
58
-
59
-
60
-
61
-
62
-
63
-
64
-
65
-
66
-
67
-
68
-
69
-
70
-
71
-
72
-
73
-
74
-
75
-
76
-
77
-
78
-
79
-
80
-
81
-
82
-
83
-
84
-
85
-
86
-
87
-
88
-
89
-
90
-
91
-
92
-
93
-
94
-
95
-
96
-
97
-
98
-
99
-
100
-
101
-
102
-
103
-
104
-
105
-
106
-
107
-
108
-
109
-
110
-
111
-
112
-
113
-
114
-
115
-
116
-
117
-
118
-
119
-
120
-
121
-
122
-
123
-
124
-
125
-
126
-
127
-
128
-
129
-
130
-
131
-
132
-
133
-
134
-
135
-
136
-
137
-
138
-
139
-
140
-
141
-
142
-
143
-
144
-
145
-
146
-
147
-
148
-
149
-
150
-
151
-
152
-
153
-
154
-
155
-
156
-
157
-
158
-
159
-
160
-
161
-
162
-
163
-
164
-
165
-
166
-
167
-
168
-
169
-
170
-
171
-
172
-
173
-
174
-
175
-
176
-
177
-
178
-
179
-
180
-
181
-
182
-
183
-
184
-
185
-
186
-
187
-
188
-
189
-
190
-
191
-
192
-
193
-
194
-
195
-
196
-
197
-
198
-
 199
199 -
 200
200 -
 201
201 -
 202
202 -
 203
203 -
 204
204 -
 205
205 -
 206
206 -
 207
207 -
 208
208 -
 209
209 -
 210
210 -
 211
211 -
 212
212 -
 213
213 -
 214
214 -
 215
215 -
 216
216 -
 217
217 -
 218
218 -
 219
219 -
220
-
221
-
222
-
223
-
224
-
225
-
226
-
227
-
228
-
229
-
230
-
231
-
232
-
233
-
234
-
235
-
236
-
237
-
238
-
239
-
240
-
241
-
242
-
243
-
244
-
245
-
246
-
247
-
248
-
249
-
250
-
251
-
252
-
253
-
254
-
255
-
256
-
257
-
258
-
259
-
260
-
261
-
262
-
263
-
264
-
265
-
266
-
267
-
268
 |
 |

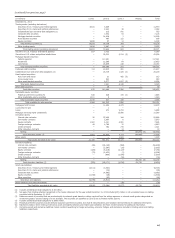
using counterparty specific credit risk limits, using master traded markets are settled through a central clearing
netting arrangements and obtaining collateral. Derivative organization and are excluded from this percentage. In addition
contracts executed in over-the-counter markets include bilateral to the netting amounts included in the table, we also have
contractual arrangements that are not cleared through a central balance sheet netting related to resale and repurchase
clearing organization but are typically subject to master netting agreements that are disclosed within Note 14 (Guarantees,
arrangements. The percentage of our bilateral derivative Pledged Assets and Collateral).
transactions outstanding at period end in such markets, based
on gross fair value, is provided within the following table. Other
derivative contracts executed in over-the-counter or exchange-
Gross Gross amounts
amounts not offset in
offset in consolidated Percent
Gross consolidated Net amounts in balance sheet exchanged in
amounts balance consolidated (Disclosure-only Net over-the-counter
(in millions) recognized sheet (1) balance sheet (2) netting) (3) amounts market (4)
December 31, 2014
Derivative assets
Interest rate contracts $ 63,698 (56,051) 7,647 (769) 6,878 45%
Commodity contracts 7,461 (1,233) 6,228 (72) 6,156 27
Equity contracts 9,005 (2,842) 6,163 (405) 5,758 54
Foreign exchange contracts 7,404 (4,923) 2,481 (85) 2,396 98
Credit contracts-protection sold 151 (131) 20 — 20 90
Credit contracts-protection purchased 755 (689) 66 (1) 65 100
Total derivative assets $ 88,474 (65,869) 22,605 (1,332) 21,273
Derivative liabilities
Interest rate contracts $ 60,059 (54,394) 5,665 (4,244) 1,421 44%
Commodity contracts 7,702 (1,459) 6,243 (33) 6,210 81
Equity contracts 7,038 (2,845) 4,193 (484) 3,709 82
Foreign exchange contracts 7,827 (5,511) 2,316 (270) 2,046 100
Credit contracts-protection sold 943 (713) 230 (199) 31 100
Credit contracts-protection purchased 168 (121) 47 (18) 29 86
Other contracts 44 — 44 — 44 100
Total derivative liabilities $ 83,781 (65,043) 18,738 (5,248) 13,490
December 31, 2013
Derivative assets
Interest rate contracts $ 55,846 (48,271) 7,575 (1,101) 6,474 65 %
Commodity contracts 2,673 (659) 2,014 (72) 1,942 52
Equity contracts 7,824 (3,254) 4,570 (239) 4,331 81
Foreign exchange contracts 4,843 (3,567) 1,276 (9) 1,267 100
Credit contracts-protection sold 354 (302) 52 — 52 92
Credit contracts-protection purchased 1,147 (841) 306 (33) 273 100
Other contracts 13 — 13 — 13 100
Total derivative assets $ 72,700 (56,894) 15,806 (1,454) 14,352
Derivative liabilities
Interest rate contracts $ 56,538 (53,902) 2,636 (482) 2,154 66 %
Commodity contracts 2,603 (952) 1,651 (11) 1,640 73
Equity contracts 7,794 (3,502) 4,292 (124) 4,168 94
Foreign exchange contracts 4,508 (3,652) 856 — 856 100
Credit contracts-protection sold 1,532 (1,432) 100 — 100 100
Credit contracts-protection purchased 368 (299) 69 — 69 89
Other contracts 16 — 16 — 16 100
Total derivative liabilities $ 73,359 (63,739) 9,620 (617) 9,003
(1) Represents amounts with counterparties subject to enforceable master netting arrangements that have been offset in the consolidated balance sheet, including related cash
collateral and portfolio level counterparty valuation adjustments. Counterparty valuation adjustments were $266 million and $236 million related to derivative assets and
$56 million and $67 million related to derivative liabilities as of December 31, 2014 and 2013, respectively. Cash collateral totaled $5.2 billion and $4.6 billion, netted against
derivative assets and liabilities, respectively, at December 31, 2014, and $4.3 billion and $11.3 billion, respectively, at December 31, 2013.
(2) Net derivative assets of $16.9 billion and $14.4 billion are classified in Trading assets as of December 31, 2014 and 2013, respectively. $5.7 billion and $1.4 billion are
classified in Other assets in the consolidated balance sheet as of December 31, 2014 and 2013, respectively. Net derivative liabilities are classified in Accrued expenses and
other liabilities in the consolidated balance sheet.
(3) Represents the fair value of non-cash collateral pledged and received against derivative assets and liabilities with the same counterparty that are subject to enforceable
master netting arrangements. U.S. GAAP does not permit netting of such non-cash collateral balances in the consolidated balance sheet but requires disclosure of these
amounts.
(4) Represents derivatives executed in over-the-counter markets not settled through a central clearing organization. Over-the-counter percentages are calculated based on
Gross amounts recognized as of the respective balance sheet date. The remaining percentage represents derivatives settled through a central clearing organization, which
are executed in either over-the-counter or exchange-traded markets.
207