Wells Fargo 2014 Annual Report Download - page 78
Download and view the complete annual report
Please find page 78 of the 2014 Wells Fargo annual report below. You can navigate through the pages in the report by either clicking on the pages listed below, or by using the keyword search tool below to find specific information within the annual report.-
 1
1 -
2
-
3
-
4
-
5
-
6
-
7
-
8
-
9
-
10
-
11
-
12
-
13
-
14
-
15
-
16
-
17
-
18
-
19
-
20
-
21
-
22
-
23
-
24
-
25
-
26
-
27
-
28
-
29
-
30
-
31
-
32
-
33
-
34
-
35
-
36
-
37
-
38
-
39
-
40
-
41
-
42
-
43
-
44
-
45
-
46
-
47
-
48
-
49
-
50
-
51
-
52
-
53
-
54
-
55
-
56
-
57
-
58
-
59
-
60
-
61
-
62
-
63
-
64
-
65
-
66
-
67
-
 68
68 -
 69
69 -
 70
70 -
 71
71 -
 72
72 -
 73
73 -
 74
74 -
 75
75 -
 76
76 -
 77
77 -
 78
78 -
 79
79 -
 80
80 -
 81
81 -
 82
82 -
 83
83 -
 84
84 -
 85
85 -
 86
86 -
 87
87 -
 88
88 -
89
-
90
-
91
-
92
-
93
-
94
-
95
-
96
-
97
-
98
-
99
-
100
-
101
-
102
-
103
-
104
-
105
-
106
-
107
-
108
-
109
-
110
-
111
-
112
-
113
-
114
-
115
-
116
-
117
-
118
-
119
-
120
-
121
-
122
-
123
-
124
-
125
-
126
-
127
-
128
-
129
-
130
-
131
-
132
-
133
-
134
-
135
-
136
-
137
-
138
-
139
-
140
-
141
-
142
-
143
-
144
-
145
-
146
-
147
-
148
-
149
-
150
-
151
-
152
-
153
-
154
-
155
-
156
-
157
-
158
-
159
-
160
-
161
-
162
-
163
-
164
-
165
-
166
-
167
-
168
-
169
-
170
-
171
-
172
-
173
-
174
-
175
-
176
-
177
-
178
-
179
-
180
-
181
-
182
-
183
-
184
-
185
-
186
-
187
-
188
-
189
-
190
-
191
-
192
-
193
-
194
-
195
-
196
-
197
-
198
-
199
-
200
-
201
-
202
-
203
-
204
-
205
-
206
-
207
-
208
-
209
-
210
-
211
-
212
-
213
-
214
-
215
-
216
-
217
-
218
-
219
-
220
-
221
-
222
-
223
-
224
-
225
-
226
-
227
-
228
-
229
-
230
-
231
-
232
-
233
-
234
-
235
-
236
-
237
-
238
-
239
-
240
-
241
-
242
-
243
-
244
-
245
-
246
-
247
-
248
-
249
-
250
-
251
-
252
-
253
-
254
-
255
-
256
-
257
-
258
-
259
-
260
-
261
-
262
-
263
-
264
-
265
-
266
-
267
-
268
 |
 |
Risk Management - Credit Risk Management (continued)
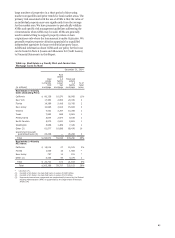
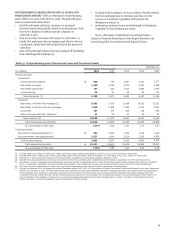
Table 34: Foreclosed Assets
Quarter ended
Dec 31, Sep 30, Jun 30, Mar 31, Year ended Dec 31,
(in millions) 2014 2014 2014 2014 2014 2013
Summary by loan segment
Government insured/guaranteed (1) $ 982 1,140 1,257 1,609 982 2,093
PCI loans:
Commercial 352 394 457 461 352 497
Consumer 212 214 208 177 212 149
Total PCI loans 564 608 665 638 564 646
All other loans:
Commercial 565 579 634 736 565 759
Consumer 498 504 449 439 498 439
Total all other loans 1,063 1,083 1,083 1,175 1,063 1,198
Total foreclosed assets $ 2,609 2,831 3,005 3,422 2,609 3,937
Analysis of changes in foreclosed assets
Balance, beginning of period $ 2,831 3,005 3,422 3,937 3,937 4,023
Net change in government insured/guaranteed (1)(2) (158) (117) (352) (484) (1,111) 584
Additions to foreclosed assets (3) 362 364 421 448 1,595 1,852
Reductions:
Sales (462) (421) (493) (490) (1,866) (2,673)
Write-downs and net gains (losses) on sales 36 — 7 11 54 151
Total reductions (426) (421) (486) (479) (1,812) (2,522)
Balance, end of period $ 2,609 2,831 3,005 3,422 2,609 3,937
(1) During fourth quarter 2014, we adopted Accounting Standards Update (ASU) 2014-14, Classification of Certain Government-Guaranteed Mortgage Loans Upon Foreclosure,
effective as of January 1, 2014. This ASU requires that government guaranteed residential real estate mortgage loans that meet specific criteria be recognized as other
receivables upon foreclosure; previously, these assets were included in foreclosed assets. Government guaranteed residential real estate mortgage loans that completed
foreclosure during 2014 and met the criteria specified by ASU 2014-14 totaled $1.5 billion, $1.1 billion, and $693 million at September 30, 2014, June 30, 2014, and
March 31, 2014, respectively, and are excluded from this table. For more information on the changes in foreclosures for government guaranteed residential real estate
mortgage loans, see Note 1 (Summary of Significant Accounting Policies) and Note 7 (Premises, Equipment, Lease Commitments and Other Assets).
(2) Foreclosed government insured/guaranteed loans are temporarily transferred to and held by us as servicer, until reimbursement is received from FHA or VA. The net change
in government insured/guaranteed foreclosed assets is made up of inflows from mortgages held for investment and MHFS, and outflows when we are reimbursed by FHA/
VA. Transfers from government insured/guaranteed loans to foreclosed assets amounted to $45 million, $41 million, $43 million, and $62 million for the quarters ended
December 31, September 30, June 30, and March 31, 2014 and $191 million and $2.9 billion for the years ended December 31, 2014 and 2013, respectively. The amounts
previously reported for the quarterly net change in government insured/guaranteed foreclosed assets have been revised to exclude $375 million, $409 million and
$693 million at September 30, 2014, June 30, 2014, and March 31, 2014, respectively, to reflect the impact of the adoption of ASU 2014-14.
(3) Predominantly include loans moved into foreclosure from nonaccrual status, PCI loans transitioned directly to foreclosed assets and repossessed automobiles.
Foreclosed assets at December 31, 2014, included
$1.6 billion of foreclosed residential real estate that had
collateralized commercial and consumer loans, of which 59% is
predominantly FHA insured or VA guaranteed and expected to
have minimal or no loss content. The remaining foreclosed
assets balance of $1.0 billion has been written down to estimated
net realizable value. The decrease in foreclosed assets at
December 31, 2014, compared with December 31, 2013, was the
result of the adoption of ASU 2014-14, which requires that
government guaranteed residential real estate mortgage loans
that meet specific criteria be recognized as other receivables
upon foreclosure (previously, these were included in foreclosed
assets). Of the $2.6 billion in foreclosed assets at December 31,
2014, 33% have been in the foreclosed assets portfolio one year
or less.
76