Wells Fargo 2014 Annual Report Download - page 51
Download and view the complete annual report
Please find page 51 of the 2014 Wells Fargo annual report below. You can navigate through the pages in the report by either clicking on the pages listed below, or by using the keyword search tool below to find specific information within the annual report.-
 1
1 -
2
-
3
-
4
-
5
-
6
-
7
-
8
-
9
-
10
-
11
-
12
-
13
-
14
-
15
-
16
-
17
-
18
-
19
-
20
-
21
-
22
-
23
-
24
-
25
-
26
-
27
-
28
-
29
-
30
-
31
-
32
-
33
-
34
-
35
-
36
-
37
-
38
-
39
-
40
-
 41
41 -
 42
42 -
 43
43 -
 44
44 -
 45
45 -
 46
46 -
 47
47 -
 48
48 -
 49
49 -
 50
50 -
 51
51 -
 52
52 -
 53
53 -
 54
54 -
 55
55 -
 56
56 -
 57
57 -
 58
58 -
 59
59 -
 60
60 -
 61
61 -
62
-
63
-
64
-
65
-
66
-
67
-
68
-
69
-
70
-
71
-
72
-
73
-
74
-
75
-
76
-
77
-
78
-
79
-
80
-
81
-
82
-
83
-
84
-
85
-
86
-
87
-
88
-
89
-
90
-
91
-
92
-
93
-
94
-
95
-
96
-
97
-
98
-
99
-
100
-
101
-
102
-
103
-
104
-
105
-
106
-
107
-
108
-
109
-
110
-
111
-
112
-
113
-
114
-
115
-
116
-
117
-
118
-
119
-
120
-
121
-
122
-
123
-
124
-
125
-
126
-
127
-
128
-
129
-
130
-
131
-
132
-
133
-
134
-
135
-
136
-
137
-
138
-
139
-
140
-
141
-
142
-
143
-
144
-
145
-
146
-
147
-
148
-
149
-
150
-
151
-
152
-
153
-
154
-
155
-
156
-
157
-
158
-
159
-
160
-
161
-
162
-
163
-
164
-
165
-
166
-
167
-
168
-
169
-
170
-
171
-
172
-
173
-
174
-
175
-
176
-
177
-
178
-
179
-
180
-
181
-
182
-
183
-
184
-
185
-
186
-
187
-
188
-
189
-
190
-
191
-
192
-
193
-
194
-
195
-
196
-
197
-
198
-
199
-
200
-
201
-
202
-
203
-
204
-
205
-
206
-
207
-
208
-
209
-
210
-
211
-
212
-
213
-
214
-
215
-
216
-
217
-
218
-
219
-
220
-
221
-
222
-
223
-
224
-
225
-
226
-
227
-
228
-
229
-
230
-
231
-
232
-
233
-
234
-
235
-
236
-
237
-
238
-
239
-
240
-
241
-
242
-
243
-
244
-
245
-
246
-
247
-
248
-
249
-
250
-
251
-
252
-
253
-
254
-
255
-
256
-
257
-
258
-
259
-
260
-
261
-
262
-
263
-
264
-
265
-
266
-
267
-
268
 |
 |

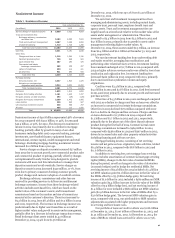
Wealth, Brokerage and Retirement reported net income of
$2.1 billion in 2014, up $371 million, or 22%, from 2013, which
was up 29% from $1.3 billion in 2012. Net income growth in
2014 was driven by significant growth in noninterest income and
net interest income. Growth in net income for 2013 was driven
by higher noninterest income and lower provision for credit
losses due to improved credit quality. Revenue of $14.2 billion in
2014 increased $1.0 billion from 2013, which was up 9% from
$12.2 billion in 2012. The increase in revenue for both 2014 and
2013 was due to increases in both net interest income and
noninterest income. Net interest income increased 10% in 2014
due to growth in investment portfolios and loan balances. Net
interest income increased 4% in 2013 due to growth in loan
balances and low-cost core deposits, partially offset by lower
interest rates on the loan and investment portfolios.
Average loan balances of $52.1 billion in 2014 increased 13%
from $46.1 billion in 2013, which was up 8% from $42.7 billion
in 2012. Average core deposits in 2014 of $154.9 billion
increased 3% from $150.1 billion in 2013, which was up 9% from
Balance Sheet Analysis
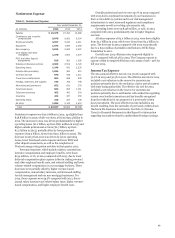
$137.5 billion in 2012. Noninterest income increased 7% in 2014
from 2013, largely due to strong growth in asset-based fees from
growth in assets under management primarily from net inflows
and improved market performance, partially offset by lower
brokerage transaction revenue. Noninterest income increased
10% in 2013 from 2012, largely due to strong growth in asset-
based fees from improved market performance and growth in
assets under management, partially offset by reduced securities
gains in the brokerage business. Noninterest expense of
$10.9 billion for 2014 was up 4% from $10.5 billion in 2013,
which was up 6% from $9.9 billion in 2012. The increase in 2014
was predominantly due to increased broker commissions and
higher non-personnel expenses. The increase in 2013 was
predominantly due to higher personnel expenses, primarily
reflecting increased broker commissions. The provision for
credit losses improved for both 2014 and 2013, driven by lower
net charge-offs and continued improvement in credit quality.
At December 31, 2014, our assets totaled $1.7 trillion, up
$163.7 billion from December 31, 2013. The predominant areas
of asset growth were in federal funds sold and other short-term
investments, which increased $44.6 billion, investment
securities, which increased $48.6 billion, loans, which increased
$40.3 billion ($50.0 billion excluding the transfer of $9.7 billion
of government guaranteed student loans to loans held for sale at
June 30, 2014), and trading assets, which increased
$15.4 billion. Deposit growth of $89.1 billion, an increase in
long-term debt of $30.9 billion, total equity growth of
$14.3 billion and an increase in short-term borrowings of
$9.6 billion from December 31, 2013, were the predominant
sources that funded our asset growth for 2014. Equity growth
benefited from $14.7 billion in earnings net of dividends paid.
The strength of our business model produced record earnings
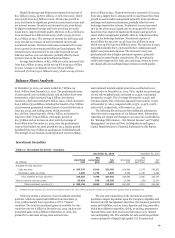
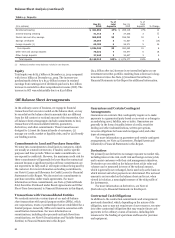
Investment Securities
Table 10: Investment Securities – Summary
and continued internal capital generation as reflected in our
capital ratios at December 31, 2014. Tier 1 capital as a percentage
of total risk-weighted assets increased to 12.45%, total capital
increased to 15.53%, Tier 1 leverage decreased to 9.45%, and
Common Equity Tier 1 (General Approach) increased to 11.04%
at December 31, 2014, compared with 12.33%, 15.43%, 9.60%,
and 10.82%, respectively, at December 31, 2013.
The following discussion provides additional information
about the major components of our balance sheet. Information
regarding our capital and changes in our asset mix is included in
the “Earnings Performance – Net Interest Income” and “Capital
Management” sections and Note 26 (Regulatory and Agency
Capital Requirements) to Financial Statements in this Report.
December 31, 2014 December 31, 2013
Net Net
Amortized unrealized Fair Amortized unrealized Fair
(in millions) Cost gain value Cost gain (loss) value
Available-for-sale securities:
Debt securities $ 247,747 6,019 253,766 246,048 2,574 248,622
Marketable equity securities 1,906 1,770 3,676 2,039 1,346 3,385
Total available-for-sale securities 249,653 7,789 257,442 248,087 3,920 252,007
Held-to-maturity debt securities 55,483 876 56,359 12,346 (99) 12,247
Total investment securities (1) $ 305,136 8,665 313,801 260,433 3,821 264,254
(1) Available-for-sale securities are carried on the balance sheet at fair value. Held-to-maturity securities are carried on the balance sheet at amortized cost.
Table 10 presents a summary of our investment securities The size and composition of the investment securities
portfolio, which increased $48.6 billion from December 31, portfolio is largely dependent upon the Company’s liquidity and
2013, predominantly due to purchases of U.S. Treasury interest rate risk management objectives. Our business generates
securities. The total net unrealized gains on available-for-sale assets and liabilities, such as loans, deposits and long-term debt,
securities were $7.8 billion at December 31, 2014, up from net which have different maturities, yields, re-pricing, prepayment
unrealized gains of $3.9 billion at December 31, 2013, due characteristics and other provisions that expose us to interest
primarily to a decrease in long-term interest rates. rate and liquidity risk. The available-for-sale securities portfolio
consists primarily of liquid, high quality U.S. Treasury and
49