Wells Fargo 2014 Annual Report Download - page 246
Download and view the complete annual report
Please find page 246 of the 2014 Wells Fargo annual report below. You can navigate through the pages in the report by either clicking on the pages listed below, or by using the keyword search tool below to find specific information within the annual report.-
 1
1 -
2
-
3
-
4
-
5
-
6
-
7
-
8
-
9
-
10
-
11
-
12
-
13
-
14
-
15
-
16
-
17
-
18
-
19
-
20
-
21
-
22
-
23
-
24
-
25
-
26
-
27
-
28
-
29
-
30
-
31
-
32
-
33
-
34
-
35
-
36
-
37
-
38
-
39
-
40
-
41
-
42
-
43
-
44
-
45
-
46
-
47
-
48
-
49
-
50
-
51
-
52
-
53
-
54
-
55
-
56
-
57
-
58
-
59
-
60
-
61
-
62
-
63
-
64
-
65
-
66
-
67
-
68
-
69
-
70
-
71
-
72
-
73
-
74
-
75
-
76
-
77
-
78
-
79
-
80
-
81
-
82
-
83
-
84
-
85
-
86
-
87
-
88
-
89
-
90
-
91
-
92
-
93
-
94
-
95
-
96
-
97
-
98
-
99
-
100
-
101
-
102
-
103
-
104
-
105
-
106
-
107
-
108
-
109
-
110
-
111
-
112
-
113
-
114
-
115
-
116
-
117
-
118
-
119
-
120
-
121
-
122
-
123
-
124
-
125
-
126
-
127
-
128
-
129
-
130
-
131
-
132
-
133
-
134
-
135
-
136
-
137
-
138
-
139
-
140
-
141
-
142
-
143
-
144
-
145
-
146
-
147
-
148
-
149
-
150
-
151
-
152
-
153
-
154
-
155
-
156
-
157
-
158
-
159
-
160
-
161
-
162
-
163
-
164
-
165
-
166
-
167
-
168
-
169
-
170
-
171
-
172
-
173
-
174
-
175
-
176
-
177
-
178
-
179
-
180
-
181
-
182
-
183
-
184
-
185
-
186
-
187
-
188
-
189
-
190
-
191
-
192
-
193
-
194
-
195
-
196
-
197
-
198
-
199
-
200
-
201
-
202
-
203
-
204
-
205
-
206
-
207
-
208
-
209
-
210
-
211
-
212
-
213
-
214
-
215
-
216
-
217
-
218
-
219
-
220
-
221
-
222
-
223
-
224
-
225
-
226
-
227
-
228
-
229
-
230
-
231
-
232
-
233
-
234
-
235
-
 236
236 -
 237
237 -
 238
238 -
 239
239 -
 240
240 -
 241
241 -
 242
242 -
 243
243 -
 244
244 -
 245
245 -
 246
246 -
 247
247 -
 248
248 -
 249
249 -
 250
250 -
 251
251 -
 252
252 -
 253
253 -
 254
254 -
 255
255 -
 256
256 -
257
-
258
-
259
-
260
-
261
-
262
-
263
-
264
-
265
-
266
-
267
-
268
 |
 |

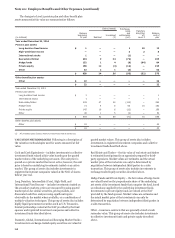
Note 20: Employee Benefits and Other Expenses (continued)
Plan Assumptions Policies).The weighted-average discount rates used to estimate
For additional information on our pension accounting the projected benefit obligation for pension benefits were:
assumptions, see Note 1 (Summary of Significant Accounting
December 31, 2014 December 31, 2013
Pension benefits Pension benefits
Discount rate
Qualified
4.00%
Non-
qualified
3.75
Other
benefits
4.00
Qualified
4.75
Non-
qualified
4.25
Other
benefits
4.50
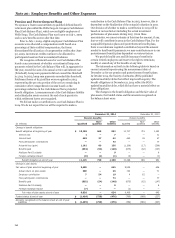
The weighted-average assumptions used to determine the
net periodic benefit cost were:
December 31, 2014 December 31, 2013 December 31, 2012
Pension benefits Pension benefits Pension benefits
Non- Other Non- Other Non- Other
Qualified qualified benefits Qualified qualified benefits Qualified qualified benefits
Discount rate (1) 4.75% 4.16 4.50 4.38 4.08 3.75 5.00 4.92 4.75
Expected return on plan assets 7.00 n/a 6.00 7.50 n/a 6.00 7.50 n/a 6.00
(1) The discount rate for the 2013 qualified pension benefits and for the 2014, 2013, and 2012 nonqualified pension benefits includes the impact of quarter-end
remeasurements when settlement losses are recognized.
To account for postretirement health care plans we use
health care cost trend rates to recognize the effect of expected
changes in future health care costs due to medical inflation,
utilization changes, new technology, regulatory requirements
and Medicare cost shifting. In determining the end of year
benefit obligation we assume an average annual increase of
approximately 7.00%, for health care costs in 2015. This rate is
assumed to trend down 0.25% per year until the trend rate
reaches an ultimate rate of 5.00% in 2023. The 2014 periodic
benefit cost was determined using an initial annual trend rate of
7.25%. This rate was assumed to decrease 0.25% per year until
the trend rate reached an ultimate rate of 5.00% in 2023.
Increasing the assumed health care trend by one percentage
point in each year would increase the benefit obligation as of
December 31, 2014, by $45 million and the total of the interest
cost and service cost components of the net periodic benefit cost
for 2014 by $2 million. Decreasing the assumed health care
trend by one percentage point in each year would decrease the
benefit obligation as of December 31, 2014, by $40 million and
the total of the interest cost and service cost components of the
net periodic benefit cost for 2014 by $2 million.
Investment Strategy and Asset Allocation
We seek to achieve the expected long-term rate of return with a
prudent level of risk given the benefit obligations of the pension
plans and their funded status. Our overall investment strategy is
designed to provide our Cash Balance Plan with long-term
growth opportunities while ensuring that risk is mitigated
through diversification across numerous asset classes and
various investment strategies. We target the asset allocation for
our Cash Balance Plan at a target mix range of 30% -50%
equities, 40% -60% fixed income, and approximately 10% in real
estate, venture capital, private equity and other investments. The
Employee Benefit Review Committee (EBRC), which includes
several members of senior management, formally reviews the
investment risk and performance of our Cash Balance Plan on a
quarterly basis. Annual Plan liability analysis and periodic asset/
liability evaluations are also conducted.
Other benefit plan assets include (1) assets held in a 401(h)
trust, which are invested with a target mix of 40%-60% for both
equities and fixed income, and (2) assets held in the Retiree
Medical Plan Voluntary Employees' Beneficiary Association
(VEBA) trust, which are invested with a general target asset mix
of 20%-40% equities and 60%-80% fixed income. In addition,
the strategy for the VEBA trust assets considers the effect of
income taxes by utilizing a combination of variable annuity and
low turnover investment strategies. Members of the EBRC
formally review the investment risk and performance of these
assets on a quarterly basis.
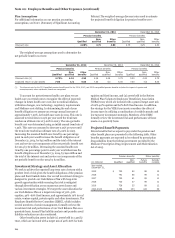
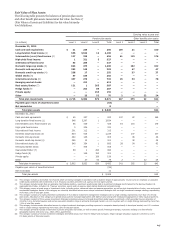
Projected Benefit Payments
Future benefits that we expect to pay under the pension and
other benefit plans are presented in the following table. Other
benefits payments are expected to be reduced by prescription
drug subsidies from the federal government provided by the
Medicare Prescription Drug, Improvement and Modernization
Act of 2003.
Pension benefits Other benefits
(in millions) Qualified Non-
qualified Future
benefits Subsidy
receipts
Year ended
December 31,
2015 $ 750 92 88 10
2016 741 66 89 11
2017 732 61 89 11
2018 730 57 89 11
2019 738 55 89 12
2020-2024 3,568 233 424 59
244