Wells Fargo 2014 Annual Report Download - page 64
Download and view the complete annual report
Please find page 64 of the 2014 Wells Fargo annual report below. You can navigate through the pages in the report by either clicking on the pages listed below, or by using the keyword search tool below to find specific information within the annual report.-
 1
1 -
2
-
3
-
4
-
5
-
6
-
7
-
8
-
9
-
10
-
11
-
12
-
13
-
14
-
15
-
16
-
17
-
18
-
19
-
20
-
21
-
22
-
23
-
24
-
25
-
26
-
27
-
28
-
29
-
30
-
31
-
32
-
33
-
34
-
35
-
36
-
37
-
38
-
39
-
40
-
41
-
42
-
43
-
44
-
45
-
46
-
47
-
48
-
49
-
50
-
51
-
52
-
53
-
 54
54 -
 55
55 -
 56
56 -
 57
57 -
 58
58 -
 59
59 -
 60
60 -
 61
61 -
 62
62 -
 63
63 -
 64
64 -
 65
65 -
 66
66 -
 67
67 -
 68
68 -
 69
69 -
 70
70 -
 71
71 -
 72
72 -
 73
73 -
 74
74 -
75
-
76
-
77
-
78
-
79
-
80
-
81
-
82
-
83
-
84
-
85
-
86
-
87
-
88
-
89
-
90
-
91
-
92
-
93
-
94
-
95
-
96
-
97
-
98
-
99
-
100
-
101
-
102
-
103
-
104
-
105
-
106
-
107
-
108
-
109
-
110
-
111
-
112
-
113
-
114
-
115
-
116
-
117
-
118
-
119
-
120
-
121
-
122
-
123
-
124
-
125
-
126
-
127
-
128
-
129
-
130
-
131
-
132
-
133
-
134
-
135
-
136
-
137
-
138
-
139
-
140
-
141
-
142
-
143
-
144
-
145
-
146
-
147
-
148
-
149
-
150
-
151
-
152
-
153
-
154
-
155
-
156
-
157
-
158
-
159
-
160
-
161
-
162
-
163
-
164
-
165
-
166
-
167
-
168
-
169
-
170
-
171
-
172
-
173
-
174
-
175
-
176
-
177
-
178
-
179
-
180
-
181
-
182
-
183
-
184
-
185
-
186
-
187
-
188
-
189
-
190
-
191
-
192
-
193
-
194
-
195
-
196
-
197
-
198
-
199
-
200
-
201
-
202
-
203
-
204
-
205
-
206
-
207
-
208
-
209
-
210
-
211
-
212
-
213
-
214
-
215
-
216
-
217
-
218
-
219
-
220
-
221
-
222
-
223
-
224
-
225
-
226
-
227
-
228
-
229
-
230
-
231
-
232
-
233
-
234
-
235
-
236
-
237
-
238
-
239
-
240
-
241
-
242
-
243
-
244
-
245
-
246
-
247
-
248
-
249
-
250
-
251
-
252
-
253
-
254
-
255
-
256
-
257
-
258
-
259
-
260
-
261
-
262
-
263
-
264
-
265
-
266
-
267
-
268
 |
 |

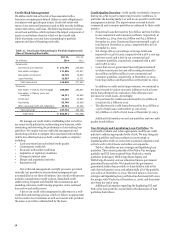
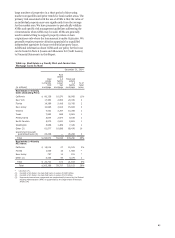
Risk Management - Credit Risk Management (continued)
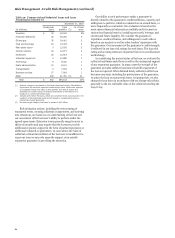
Table 20: Commercial and Industrial Loans and Lease
Financing by Industry (1)
December 31, 2014
Nonaccrual Total % of total
(in millions) loans portfolio (2) loans
Investors $ 40 39,192 5%
Financial institutions 26 38,256 4
Oil and gas 76 18,410 2
Food and beverage 16 14,029 2
Real estate lessor 3 13,030 2
Cyclical retailers 24 12,971 2
Healthcare 26 12,914 1
Industrial equipment 4 12,898 1
Technology 9 8,320 1
Public administration 10 8,120 1
Transportation 3 7,184 1
Business services 27 7,018 1
Other 298 91,760 (3) 10
Total $ 562 284,102 33%
(1) Industry categories are based on the North American Industry Classification
System and the amounts reported include foreign loans, which were reported
in a separate foreign loan class in prior periods. See Note 6 (Loans and
Allowance for Credit Losses) to Financial Statements in this Report for a
breakout of commercial foreign loans.
(2) Includes $75 million PCI loans, which are considered to be accruing due to the
existence of the accretable yield and not based on consideration given to
contractual interest payments.
(3) No other single category had loans in excess of $5.5 billion.
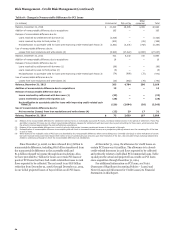
Risk mitigation actions, including the restructuring of
repayment terms, securing collateral or guarantees, and entering
into extensions, are based on a re-underwriting of the loan and
our assessment of the borrower’s ability to perform under the
agreed-upon terms. Extension terms generally range from six to
thirty-six months and may require that the borrower provide
additional economic support in the form of partial repayment, or
additional collateral or guarantees. In cases where the value of
collateral or financial condition of the borrower is insufficient to
repay our loan, we may rely upon the support of an outside
repayment guarantee in providing the extension.
Our ability to seek performance under a guarantee is
directly related to the guarantor’s creditworthiness, capacity and
willingness to perform, which is evaluated on an annual basis, or
more frequently as warranted. Our evaluation is based on the
most current financial information available and is focused on
various key financial metrics, including net worth, leverage, and
current and future liquidity. We consider the guarantor’s
reputation, creditworthiness, and willingness to work with us
based on our analysis as well as other lenders’ experience with
the guarantor. Our assessment of the guarantor’s credit strength
is reflected in our loan risk ratings for such loans. The loan risk
rating and accruing status are important factors in our allowance
methodology.
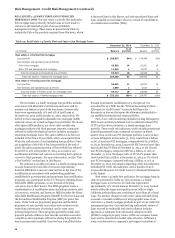
In considering the accrual status of the loan, we evaluate the
collateral and future cash flows as well as the anticipated support
of any repayment guarantor. In many cases the strength of the
guarantor provides sufficient assurance that full repayment of
the loan is expected. When full and timely collection of the loan
becomes uncertain, including the performance of the guarantor,
we place the loan on nonaccrual status. As appropriate, we also
charge the loan down in accordance with our charge-off policies,
generally to the net realizable value of the collateral securing the
loan, if any.
62