Wells Fargo 2014 Annual Report Download - page 262
Download and view the complete annual report
Please find page 262 of the 2014 Wells Fargo annual report below. You can navigate through the pages in the report by either clicking on the pages listed below, or by using the keyword search tool below to find specific information within the annual report.-
 1
1 -
2
-
3
-
4
-
5
-
6
-
7
-
8
-
9
-
10
-
11
-
12
-
13
-
14
-
15
-
16
-
17
-
18
-
19
-
20
-
21
-
22
-
23
-
24
-
25
-
26
-
27
-
28
-
29
-
30
-
31
-
32
-
33
-
34
-
35
-
36
-
37
-
38
-
39
-
40
-
41
-
42
-
43
-
44
-
45
-
46
-
47
-
48
-
49
-
50
-
51
-
52
-
53
-
54
-
55
-
56
-
57
-
58
-
59
-
60
-
61
-
62
-
63
-
64
-
65
-
66
-
67
-
68
-
69
-
70
-
71
-
72
-
73
-
74
-
75
-
76
-
77
-
78
-
79
-
80
-
81
-
82
-
83
-
84
-
85
-
86
-
87
-
88
-
89
-
90
-
91
-
92
-
93
-
94
-
95
-
96
-
97
-
98
-
99
-
100
-
101
-
102
-
103
-
104
-
105
-
106
-
107
-
108
-
109
-
110
-
111
-
112
-
113
-
114
-
115
-
116
-
117
-
118
-
119
-
120
-
121
-
122
-
123
-
124
-
125
-
126
-
127
-
128
-
129
-
130
-
131
-
132
-
133
-
134
-
135
-
136
-
137
-
138
-
139
-
140
-
141
-
142
-
143
-
144
-
145
-
146
-
147
-
148
-
149
-
150
-
151
-
152
-
153
-
154
-
155
-
156
-
157
-
158
-
159
-
160
-
161
-
162
-
163
-
164
-
165
-
166
-
167
-
168
-
169
-
170
-
171
-
172
-
173
-
174
-
175
-
176
-
177
-
178
-
179
-
180
-
181
-
182
-
183
-
184
-
185
-
186
-
187
-
188
-
189
-
190
-
191
-
192
-
193
-
194
-
195
-
196
-
197
-
198
-
199
-
200
-
201
-
202
-
203
-
204
-
205
-
206
-
207
-
208
-
209
-
210
-
211
-
212
-
213
-
214
-
215
-
216
-
217
-
218
-
219
-
220
-
221
-
222
-
223
-
224
-
225
-
226
-
227
-
228
-
229
-
230
-
231
-
232
-
233
-
234
-
235
-
236
-
237
-
238
-
239
-
240
-
241
-
242
-
243
-
244
-
245
-
246
-
247
-
248
-
249
-
250
-
251
-
 252
252 -
 253
253 -
 254
254 -
 255
255 -
 256
256 -
 257
257 -
 258
258 -
 259
259 -
 260
260 -
 261
261 -
 262
262 -
 263
263 -
 264
264 -
 265
265 -
 266
266 -
 267
267 -
 268
268
 |
 |

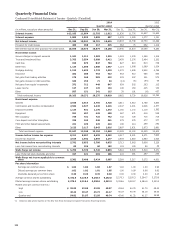
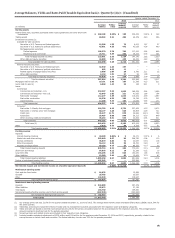
Quarterly Financial Data
Condensed Consolidated Statement of Income - Quarterly (Unaudited)
2014 2013
Quarter ended Quarter ended
(in millions, except per share amounts) Dec 31, Sep 30, Jun 30, Mar 31,
Interest income $12,183 11,964 11,793 11,612
Interest expense 1,003 1,023 1,002 997
Net interest income 11,180 10,941 10,791 10,615
Provision for credit losses 485 368 217 325
Net interest income after provision for credit losses 10,695 10,573 10,574 10,290
Noninterest income
Service charges on deposit accounts 1,241 1,311 1,283 1,215
Trust and investment fees 3,705 3,554 3,609 3,412
Card fees 925 875 847 784
Other fees 1,124 1,090 1,088 1,047
Mortgage banking 1,515 1,633 1,723 1,510
Insurance 382 388 453 432
Net gains from trading activities 179 168 382 432
Net gains (losses) on debt securities 186 253 71 83
Net gains from equity investments 372 712 449 847
Lease income 127 137 129 133
Other 507 151 241 115
Total noninterest income 10,263 10,272 10,275 10,010
Noninterest expense
Salaries 3,938 3,914 3,795 3,728
Commission and incentive compensation 2,582 2,527 2,445 2,416
Employee benefits 1,124 931 1,170 1,372
Equipment 581 457 445 490
Net occupancy 730 731 722 742
Core deposit and other intangibles 338 342 349 341
FDIC and other deposit assessments 231 229 225 243
Other 3,123 3,117 3,043 2,616
Total noninterest expense 12,647 12,248 12,194 11,948
Income before income tax expense 8,311 8,597 8,655 8,352
Income tax expense 2,519 2,642 2,869 2,277
Net income before noncontrolling interests 5,792 5,955 5,786 6,075
Less: Net income from noncontrolling interests 83 226 60 182
Wells Fargo net income $ 5,709 5,729 5,726 5,893
Less: Preferred stock dividends and other 327 321 302 286
Wells Fargo net income applicable to common
stock 5,382 5,408 5,424 5,607
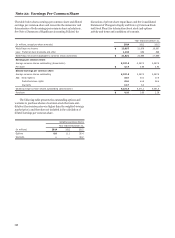
Per share information
Earnings per common share $ 1.04 1.04 1.02 1.07
Diluted earnings per common share 1.02 1.02 1.01 1.05
Dividends declared per common share 0.35 0.35 0.35 0.30
Average common shares outstanding 5,192.5 5,225.9 5,268.4 5,262.8
Diluted average common shares outstanding 5,279.2 5,310.4 5,350.8 5,353.3
Market price per common share (1)
High $ 55.95 53.80 53.05 49.97
Low 46.44 49.47 46.72 44.17
Quarter-end 54.82 51.87 52.56 49.74
Dec 31,
11,836
1,033
10,803
363
10,440
1,283
3,458
827
1,119
1,570
453
325
(14)
654
148
39
9,862
3,811
2,347
1,160
567
732
375
196
2,897
12,085
8,217
2,504
5,713
103
5,610
241
5,369
1.02
1.00
0.30
5,270.3
5,358.6
45.64
40.07
45.40
Sep 30,
11,776
1,028
10,748
75
10,673
1,278
3,276
813
1,098
1,608
413
397
(6)
502
160
191
9,730
3,910
2,401
1,172
471
728
375
214
2,831
12,102
8,301
2,618
5,683
105
5,578
261
5,317
1.00
0.99
0.30
5,295.3
5,381.7
44.79
40.79
41.32
Jun 30,
11,827
1,077
10,750
652
10,098
1,248
3,494
813
1,089
2,802
485
331
(54)
203
225
(8)
10,628
3,768
2,626
1,118
418
716
377
259
2,973
12,255
8,471
2,863
5,608
89
5,519
247
5,272
1.00
0.98
0.30
5,304.7
5,384.6
41.74
36.19
41.27
Mar 31,
11,650
1,151
10,499
1,219
9,280
1,214
3,202
738
1,034
2,794
463
570
45
113
130
457
10,760
3,663
2,577
1,583
528
719
377
292
2,661
12,400
7,640
2,420
5,220
49
5,171
240
4,931
0.93
0.92
0.25
5,279.0
5,353.5
38.20
34.43
36.99
(1) Based on daily prices reported on the New York Stock Exchange Composite Transaction Reporting System.
260