Wells Fargo 2014 Annual Report Download - page 96
Download and view the complete annual report
Please find page 96 of the 2014 Wells Fargo annual report below. You can navigate through the pages in the report by either clicking on the pages listed below, or by using the keyword search tool below to find specific information within the annual report.-
 1
1 -
2
-
3
-
4
-
5
-
6
-
7
-
8
-
9
-
10
-
11
-
12
-
13
-
14
-
15
-
16
-
17
-
18
-
19
-
20
-
21
-
22
-
23
-
24
-
25
-
26
-
27
-
28
-
29
-
30
-
31
-
32
-
33
-
34
-
35
-
36
-
37
-
38
-
39
-
40
-
41
-
42
-
43
-
44
-
45
-
46
-
47
-
48
-
49
-
50
-
51
-
52
-
53
-
54
-
55
-
56
-
57
-
58
-
59
-
60
-
61
-
62
-
63
-
64
-
65
-
66
-
67
-
68
-
69
-
70
-
71
-
72
-
73
-
74
-
75
-
76
-
77
-
78
-
79
-
80
-
81
-
82
-
83
-
84
-
85
-
 86
86 -
 87
87 -
 88
88 -
 89
89 -
 90
90 -
 91
91 -
 92
92 -
 93
93 -
 94
94 -
 95
95 -
 96
96 -
 97
97 -
 98
98 -
 99
99 -
 100
100 -
 101
101 -
 102
102 -
 103
103 -
 104
104 -
 105
105 -
 106
106 -
107
-
108
-
109
-
110
-
111
-
112
-
113
-
114
-
115
-
116
-
117
-
118
-
119
-
120
-
121
-
122
-
123
-
124
-
125
-
126
-
127
-
128
-
129
-
130
-
131
-
132
-
133
-
134
-
135
-
136
-
137
-
138
-
139
-
140
-
141
-
142
-
143
-
144
-
145
-
146
-
147
-
148
-
149
-
150
-
151
-
152
-
153
-
154
-
155
-
156
-
157
-
158
-
159
-
160
-
161
-
162
-
163
-
164
-
165
-
166
-
167
-
168
-
169
-
170
-
171
-
172
-
173
-
174
-
175
-
176
-
177
-
178
-
179
-
180
-
181
-
182
-
183
-
184
-
185
-
186
-
187
-
188
-
189
-
190
-
191
-
192
-
193
-
194
-
195
-
196
-
197
-
198
-
199
-
200
-
201
-
202
-
203
-
204
-
205
-
206
-
207
-
208
-
209
-
210
-
211
-
212
-
213
-
214
-
215
-
216
-
217
-
218
-
219
-
220
-
221
-
222
-
223
-
224
-
225
-
226
-
227
-
228
-
229
-
230
-
231
-
232
-
233
-
234
-
235
-
236
-
237
-
238
-
239
-
240
-
241
-
242
-
243
-
244
-
245
-
246
-
247
-
248
-
249
-
250
-
251
-
252
-
253
-
254
-
255
-
256
-
257
-
258
-
259
-
260
-
261
-
262
-
263
-
264
-
265
-
266
-
267
-
268
 |
 |

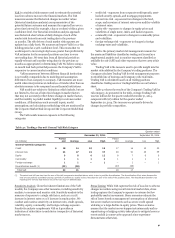
Risk Management - Asset/Liability Management (continued)
Incremental Risk Charge according to the market risk capital
rule, must capture losses due to both issuer default and
migration risk at the 99.9% confidence level over the one-year
capital horizon under the assumption of constant level of risk or
a constant position assumption. The model covers all non-
securitized credit-sensitive products.
The Company calculates Incremental Risk by generating a
portfolio loss distribution using Monte Carlo simulation, which
assumes numerous scenarios, where an assumption is made that
the portfolio’s composition remains constant for a one-year time
horizon. Individual issuer credit grade migration and issuer
default risk is modeled through generation of the issuer’s credit
rating transition based upon statistical modeling. Correlation
between credit grade migration and default is captured by a
Table 51: Market Risk Regulatory Capital Modeled Components
multifactor proprietary model which takes into account industry
classifications as well as regional effects. Additionally, the
impact of market and issuer specific concentrations is reflected
in the modeling framework by assignment of a higher charge for
portfolios that have increasing concentrations in particular
issuers or sectors. Lastly, the model captures product basis risk;
that is, it reflects the material disparity between a position and
its hedge.
Table 51 provides information on the Incremental Risk
Charge results for the quarter ended December 31, 2014. For this
charge, the required capital at quarter end equals the average for
the quarter.
Quarter ended December 31, 2014 December 31, 2014
Risk- Risk-
Quarter based weighted
(in millions) Average Low High end capital (1) assets (1)
Total VaR $ 49 39 83 50 146 1,822
Total Stressed VaR 490 440 571 480 1,469 18,359
Incremental Risk Charge 345 310 382 338 345 4,317
(1) Represents the required component amount for market risk based upon the respective VaR and Incremental Risk Charge requirements.
Securitized Products Charge Basel III requires a separate
market risk capital charge for positions classified as a
securitization or re-securitization. The primary criteria for
classification as a securitization are whether there is a transfer of
risk and whether the credit risk associated with the underlying
exposures has been separated into at least two tranches
reflecting different levels of seniority. Covered trading
securitizations positions include consumer and commercial
asset-backed securities (ABS), commercial mortgage-backed
securities (CMBS), residential mortgage-backed securities
(RMBS), and collateralized loan and other debt obligations
(CLO/CDO) positions. The securitization capital requirements
are the greater of the capital requirements of the net long or
short exposure, and are capped at the maximum loss that could
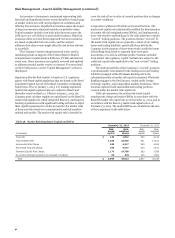
be incurred on any given transaction. Table 52 shows the
aggregate net fair market value of securities and derivative
securitization positions by exposure type that meet the
regulatory definition of a covered trading securitization position
at December 31, 2014 and 2013.
Table 52: Covered Securitization Positions by Exposure Type
(Market Value)
(in millions)
December 31, 2014
ABS CMBS RMBS CLO/CDO
Securitization exposure:
Securities
Derivatives
Total
$ 752
(1)
751
709
5
714
689
23
712
553
(31)
522
December 31, 2013
Securitization Exposure:
Securities
Derivatives
Total $
604
(2)
602
559
2
561
479
16
495
561
(72)
489
SECURITIZATION DUE DILIGENCE AND RISK MONITORING The
market risk capital rule requires that the Company conduct due
diligence on the risk of each position within three days of the
purchase of a securitization position. The Company's due
diligence on the creditworthiness of each position provides an
understanding of the features that would materially affect the
performance of a securitization or re-securitization. The due
diligence analysis is performed again on a quarterly basis for
each securitization and re-securitization position. The Company
uses an automated solution to track the due diligence associated
with securitization activity. The Company aims to manage the
risks associated with securitization and re-securitization
positions through the use of offsetting positions and portfolio
diversification.
Standardized Specific Risk Charge For debt and equity positions
that are not evaluated by the approved internal specific risk
models, a regulatory prescribed standard specific risk charge is
applied. The standard specific risk add-on for sovereign entities,
public sector entities, and depository institutions is based on the
Organization for Economic Co-operation and Development
(OECD) country risk classifications (CRC) and the remaining
contractual maturity of the position. These risk add-ons for debt
positions range from 0.25% to 12%. The add-on for corporate
debt is based on creditworthiness and the remaining contractual
maturity of the position. All other types of debt positions are
subject to an 8% add-on. The standard specific risk add-on for
equity positions is generally 8%.
Comprehensive Risk Charge / Correlation Trading The market
risk capital rule requires capital for correlation trading positions.
The Company's remaining correlation trading exposure covered
under the market risk capital rule matured in fourth quarter
2014.
VaR Backtesting The market risk capital rule requires
backtesting as one form of validation of the VaR model.
Backtesting is a comparison of the daily VaR estimate with the
actual clean profit and loss (clean P&L) as defined by the market
94