Wells Fargo 2014 Annual Report Download - page 187
Download and view the complete annual report
Please find page 187 of the 2014 Wells Fargo annual report below. You can navigate through the pages in the report by either clicking on the pages listed below, or by using the keyword search tool below to find specific information within the annual report.-
 1
1 -
2
-
3
-
4
-
5
-
6
-
7
-
8
-
9
-
10
-
11
-
12
-
13
-
14
-
15
-
16
-
17
-
18
-
19
-
20
-
21
-
22
-
23
-
24
-
25
-
26
-
27
-
28
-
29
-
30
-
31
-
32
-
33
-
34
-
35
-
36
-
37
-
38
-
39
-
40
-
41
-
42
-
43
-
44
-
45
-
46
-
47
-
48
-
49
-
50
-
51
-
52
-
53
-
54
-
55
-
56
-
57
-
58
-
59
-
60
-
61
-
62
-
63
-
64
-
65
-
66
-
67
-
68
-
69
-
70
-
71
-
72
-
73
-
74
-
75
-
76
-
77
-
78
-
79
-
80
-
81
-
82
-
83
-
84
-
85
-
86
-
87
-
88
-
89
-
90
-
91
-
92
-
93
-
94
-
95
-
96
-
97
-
98
-
99
-
100
-
101
-
102
-
103
-
104
-
105
-
106
-
107
-
108
-
109
-
110
-
111
-
112
-
113
-
114
-
115
-
116
-
117
-
118
-
119
-
120
-
121
-
122
-
123
-
124
-
125
-
126
-
127
-
128
-
129
-
130
-
131
-
132
-
133
-
134
-
135
-
136
-
137
-
138
-
139
-
140
-
141
-
142
-
143
-
144
-
145
-
146
-
147
-
148
-
149
-
150
-
151
-
152
-
153
-
154
-
155
-
156
-
157
-
158
-
159
-
160
-
161
-
162
-
163
-
164
-
165
-
166
-
167
-
168
-
169
-
170
-
171
-
172
-
173
-
174
-
175
-
176
-
 177
177 -
 178
178 -
 179
179 -
 180
180 -
 181
181 -
 182
182 -
 183
183 -
 184
184 -
 185
185 -
 186
186 -
 187
187 -
 188
188 -
 189
189 -
 190
190 -
 191
191 -
 192
192 -
 193
193 -
 194
194 -
 195
195 -
 196
196 -
 197
197 -
198
-
199
-
200
-
201
-
202
-
203
-
204
-
205
-
206
-
207
-
208
-
209
-
210
-
211
-
212
-
213
-
214
-
215
-
216
-
217
-
218
-
219
-
220
-
221
-
222
-
223
-
224
-
225
-
226
-
227
-
228
-
229
-
230
-
231
-
232
-
233
-
234
-
235
-
236
-
237
-
238
-
239
-
240
-
241
-
242
-
243
-
244
-
245
-
246
-
247
-
248
-
249
-
250
-
251
-
252
-
253
-
254
-
255
-
256
-
257
-
258
-
259
-
260
-
261
-
262
-
263
-
264
-
265
-
266
-
267
-
268
 |
 |

to fund ongoing vehicle sales operations. The third party auto
financing institutions manage the collateral in the VIEs, which is
indicative of power in them and we therefore do not consolidate
these VIEs.
TAX CREDIT STRUCTURES We co-sponsor and make
investments in affordable housing and sustainable energy
projects that are designed to generate a return primarily through
the realization of federal tax credits. In some instances, our
investments in these structures may require that we fund future
capital commitments at the discretion of the project sponsors.
While the size of our investment in a single entity may at times
exceed 50% of the outstanding equity interests, we do not
consolidate these structures due to the project sponsor’s ability
to manage the projects, which is indicative of power in them.
INVESTMENT FUNDS We do not consolidate the investment
funds because we do not absorb the majority of the expected
future variability associated with the funds’ assets, including
variability associated with credit, interest rate and liquidity risks.
OTHER TRANSACTIONS WITH VIEs Auction rate securities
(ARS) are debt instruments with long-term maturities, which re-
price more frequently, and preferred equities with no maturity.
At December 31, 2014, we held in our available-for-sale
securities portfolio $567 million of ARS issued by VIEs
compared with $653 million at December 31, 2013. We acquired
the ARS pursuant to agreements entered into in 2008 and 2009.
We do not consolidate the VIEs that issued the ARS because
we do not have power over the activities of the VIEs.
TRUST PREFERRED SECURITIES VIEs that we wholly own
issue debt securities or preferred equity to third party investors.
All of the proceeds of the issuance are invested in debt securities
or preferred equity that we issue to the VIEs. The VIEs’
operations and cash flows relate only to the issuance,
administration and repayment of the securities held by third
parties. We do not consolidate these VIEs because the sole assets
of the VIEs are receivables from us, even though we own all of
the voting equity shares of the VIEs, have fully guaranteed the
obligations of the VIEs and may have the right to redeem the
third party securities under certain circumstances. In our
consolidated balance sheet at December 31, 2014 and December
31, 2013, we reported the debt securities issued to the VIEs as
long-term junior subordinated debt with a carrying value of
$2.1 billion and $1.9 billion, respectively, and the preferred
equity securities issued to the VIEs as preferred stock with a
carrying value of $2.5 billion at both dates. These amounts are in
addition to the involvements in these VIEs included in the
preceding table.
In 2013, we redeemed $2.8 billion of trust preferred
securities that will no longer count as Tier 1 capital under the
Dodd-Frank Act and the Basel Committee recommendations
known as the Basel III standards.
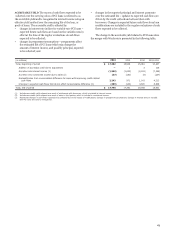
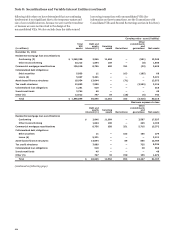
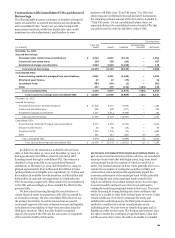
Securitization Activity Related to Unconsolidated
VIEs
We use VIEs to securitize consumer and CRE loans and other
types of financial assets. We typically retain the servicing rights
from these sales and may continue to hold other beneficial
interests in the VIEs. We may also provide liquidity to investors
in the beneficial interests and credit enhancements in the form
of standby letters of credit. Through these securitizations we
may be exposed to liability under limited amounts of recourse as
well as standard representations and warranties we make to
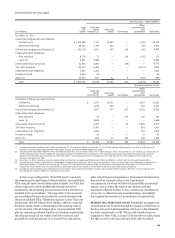
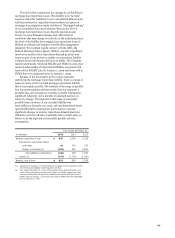
purchasers and issuers. The following table presents the cash
flows with our securitization trusts that were involved in
transfers accounted for as sales.
Year ended December 31,
2014 2013
Other Other Other
Mortgage financial Mortgage financial Mortgage financial
(in millions) loans assets loans assets loans assets
Sales proceeds from securitizations $ 164,331 — 357,807 — 535,372 —
Fees from servicing rights retained 4,062 8 4,240 10 4,433 10
Cash flows from other interests held (1) 1,417 75 2,284 93 1,767 135
Purchases of delinquent assets 6 — 18 — 62 —
Servicing advances, net of repayments (170) — (34) — 226 —
(1) Cash flows from other interests held include principal and interest payments received on retained bonds and excess cash flows received on interest-only strips.
In 2014, 2013, and 2012, we recognized net gains of
$288 million, $149 million and $518 million, respectively, from
transfers accounted for as sales of financial assets in
securitizations. These net gains primarily relate to commercial
mortgage securitizations and residential mortgage
securitizations where the loans were not already carried at fair
value.
Sales with continuing involvement during 2014, 2013 and
2012 predominantly related to securitizations of residential
mortgages that are sold to the GSEs, including FNMA, FHLMC
and GNMA (conforming residential mortgage securitizations).
During 2014, 2013 and 2012 we transferred $155.8 billion,
$343.9 billion and $517.3 billion respectively, in fair value of
conforming residential mortgages to unconsolidated VIEs and
recorded the transfers as sales. Substantially all of these
transfers did not result in a gain or loss because the loans were
already carried at fair value. In connection with all of these
transfers, in 2014 we recorded a $1.2 billion servicing asset,
measured at fair value using a Level 3 measurement technique,
available-for-sale securities of $751 million, classified as Level 2,
and a $44 million liability for repurchase losses which reflects
management’s estimate of probable losses related to various
representations and warranties for the loans transferred, initially
measured at fair value. In 2013, we recorded a $3.5 billion
servicing asset and a $143 million liability. In 2012, we recorded
a $4.9 billion servicing asset and a $275 million liability.
2012
185