Wells Fargo 2014 Annual Report Download - page 52
Download and view the complete annual report
Please find page 52 of the 2014 Wells Fargo annual report below. You can navigate through the pages in the report by either clicking on the pages listed below, or by using the keyword search tool below to find specific information within the annual report.-
 1
1 -
2
-
3
-
4
-
5
-
6
-
7
-
8
-
9
-
10
-
11
-
12
-
13
-
14
-
15
-
16
-
17
-
18
-
19
-
20
-
21
-
22
-
23
-
24
-
25
-
26
-
27
-
28
-
29
-
30
-
31
-
32
-
33
-
34
-
35
-
36
-
37
-
38
-
39
-
40
-
41
-
 42
42 -
 43
43 -
 44
44 -
 45
45 -
 46
46 -
 47
47 -
 48
48 -
 49
49 -
 50
50 -
 51
51 -
 52
52 -
 53
53 -
 54
54 -
 55
55 -
 56
56 -
 57
57 -
 58
58 -
 59
59 -
 60
60 -
 61
61 -
 62
62 -
63
-
64
-
65
-
66
-
67
-
68
-
69
-
70
-
71
-
72
-
73
-
74
-
75
-
76
-
77
-
78
-
79
-
80
-
81
-
82
-
83
-
84
-
85
-
86
-
87
-
88
-
89
-
90
-
91
-
92
-
93
-
94
-
95
-
96
-
97
-
98
-
99
-
100
-
101
-
102
-
103
-
104
-
105
-
106
-
107
-
108
-
109
-
110
-
111
-
112
-
113
-
114
-
115
-
116
-
117
-
118
-
119
-
120
-
121
-
122
-
123
-
124
-
125
-
126
-
127
-
128
-
129
-
130
-
131
-
132
-
133
-
134
-
135
-
136
-
137
-
138
-
139
-
140
-
141
-
142
-
143
-
144
-
145
-
146
-
147
-
148
-
149
-
150
-
151
-
152
-
153
-
154
-
155
-
156
-
157
-
158
-
159
-
160
-
161
-
162
-
163
-
164
-
165
-
166
-
167
-
168
-
169
-
170
-
171
-
172
-
173
-
174
-
175
-
176
-
177
-
178
-
179
-
180
-
181
-
182
-
183
-
184
-
185
-
186
-
187
-
188
-
189
-
190
-
191
-
192
-
193
-
194
-
195
-
196
-
197
-
198
-
199
-
200
-
201
-
202
-
203
-
204
-
205
-
206
-
207
-
208
-
209
-
210
-
211
-
212
-
213
-
214
-
215
-
216
-
217
-
218
-
219
-
220
-
221
-
222
-
223
-
224
-
225
-
226
-
227
-
228
-
229
-
230
-
231
-
232
-
233
-
234
-
235
-
236
-
237
-
238
-
239
-
240
-
241
-
242
-
243
-
244
-
245
-
246
-
247
-
248
-
249
-
250
-
251
-
252
-
253
-
254
-
255
-
256
-
257
-
258
-
259
-
260
-
261
-
262
-
263
-
264
-
265
-
266
-
267
-
268
 |
 |

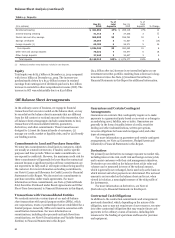
Balance Sheet Analysis (continued)
federal agency debt, agency mortgage-backed securities (MBS),
privately issued residential and commercial MBS, securities
issued by U.S. states and political subdivisions, corporate debt
securities, and highly rated collateralized loan obligations. Due
to its highly liquid nature, the available-for-sale portfolio can be
used to meet funding needs that arise in the normal course of
business or due to market stress. Changes in our interest rate
risk profile may occur due to changes in overall economic or
market conditions, which could influence loan origination
demand, prepayment speeds, or deposit balances and mix. In
response, the available-for-sale securities portfolio can be
rebalanced to meet the Company’s interest rate risk
management objectives. In addition to meeting liquidity and
interest rate risk management objectives, the available-for-sale
securities portfolio may provide yield enhancement over other
short-term assets. See the “Risk Management - Asset/Liability
Management” section in this Report for more information on
liquidity and interest rate risk. The held-to-maturity securities
portfolio consists of high quality U.S. Treasury debt, securities
issued by U.S. states and political subdivisions, agency MBS,
asset-backed securities (ABS) primarily collateralized by auto
loans and leases, and collateralized loan obligations, where our
intent is to hold these securities to maturity and collect the
contractual cash flows. The held-to-maturity portfolio may also
provide yield enhancement over short-term assets.
We analyze securities for other-than-temporary impairment
(OTTI) quarterly or more often if a potential loss-triggering
event occurs. Of the $322 million in OTTI write-downs
recognized in earnings in 2014, $49 million related to debt
securities and $3 million related to marketable equity securities,
which are each included in available-for-sale securities. Another
$270 million in OTTI write-downs was related to nonmarketable
equity investments, which are included in other assets. For a
discussion of our OTTI accounting policies and underlying
considerations and analysis see Note 1 (Summary of Significant
Accounting Policies) and Note 5 (Investment Securities) to
Financial Statements in this Report.
At December 31, 2014, investment securities included
$46.9 billion of municipal bonds, of which 91.7% were rated “A-”
or better based predominantly on external and, in some cases,
internal ratings. Additionally, some of the securities in our total
municipal bond portfolio are guaranteed against loss by bond
insurers. These guaranteed bonds are substantially all
investment grade and were generally underwritten in accordance
with our own investment standards prior to the determination to
purchase, without relying on the bond insurer’s guarantee in
making the investment decision. Our municipal bond holdings
are monitored as part of our ongoing impairment analysis.
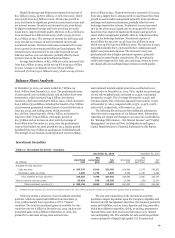
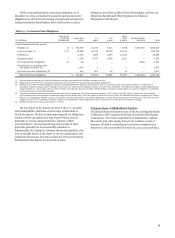
The weighted-average expected maturity of debt securities
available-for-sale was 6.2 years at December 31, 2014. Because
54% of this portfolio is MBS, the expected remaining maturity is
shorter than the remaining contractual maturity because
borrowers generally have the right to prepay obligations before
the underlying mortgages mature. The estimated effects of a
200 basis point increase or decrease in interest rates on the fair
value and the expected remaining maturity of the MBS available-
for-sale portfolio are shown in Table 11.
Table 11: Mortgage-Backed Securities
Expected
Net remaining
Fair unrealized maturity
(in billions) value gain (loss) (in years)
At December 31, 2014
Actual 136.4 4.1 4.4
Assuming a 200 basis point:
Increase in interest rates 124.8 (7.5) 6.5
Decrease in interest rates 140.4 8.1 2.5
The weighted-average expected maturity of debt securities
held-to-maturity was 6.5 years at December 31, 2014. See Note 5
(Investment Securities) to Financial Statements in this Report
for a summary of investment securities by security type.
50