Wells Fargo 2014 Annual Report Download - page 190
Download and view the complete annual report
Please find page 190 of the 2014 Wells Fargo annual report below. You can navigate through the pages in the report by either clicking on the pages listed below, or by using the keyword search tool below to find specific information within the annual report.-
 1
1 -
2
-
3
-
4
-
5
-
6
-
7
-
8
-
9
-
10
-
11
-
12
-
13
-
14
-
15
-
16
-
17
-
18
-
19
-
20
-
21
-
22
-
23
-
24
-
25
-
26
-
27
-
28
-
29
-
30
-
31
-
32
-
33
-
34
-
35
-
36
-
37
-
38
-
39
-
40
-
41
-
42
-
43
-
44
-
45
-
46
-
47
-
48
-
49
-
50
-
51
-
52
-
53
-
54
-
55
-
56
-
57
-
58
-
59
-
60
-
61
-
62
-
63
-
64
-
65
-
66
-
67
-
68
-
69
-
70
-
71
-
72
-
73
-
74
-
75
-
76
-
77
-
78
-
79
-
80
-
81
-
82
-
83
-
84
-
85
-
86
-
87
-
88
-
89
-
90
-
91
-
92
-
93
-
94
-
95
-
96
-
97
-
98
-
99
-
100
-
101
-
102
-
103
-
104
-
105
-
106
-
107
-
108
-
109
-
110
-
111
-
112
-
113
-
114
-
115
-
116
-
117
-
118
-
119
-
120
-
121
-
122
-
123
-
124
-
125
-
126
-
127
-
128
-
129
-
130
-
131
-
132
-
133
-
134
-
135
-
136
-
137
-
138
-
139
-
140
-
141
-
142
-
143
-
144
-
145
-
146
-
147
-
148
-
149
-
150
-
151
-
152
-
153
-
154
-
155
-
156
-
157
-
158
-
159
-
160
-
161
-
162
-
163
-
164
-
165
-
166
-
167
-
168
-
169
-
170
-
171
-
172
-
173
-
174
-
175
-
176
-
177
-
178
-
179
-
 180
180 -
 181
181 -
 182
182 -
 183
183 -
 184
184 -
 185
185 -
 186
186 -
 187
187 -
 188
188 -
 189
189 -
 190
190 -
 191
191 -
 192
192 -
 193
193 -
 194
194 -
 195
195 -
 196
196 -
 197
197 -
 198
198 -
 199
199 -
 200
200 -
201
-
202
-
203
-
204
-
205
-
206
-
207
-
208
-
209
-
210
-
211
-
212
-
213
-
214
-
215
-
216
-
217
-
218
-
219
-
220
-
221
-
222
-
223
-
224
-
225
-
226
-
227
-
228
-
229
-
230
-
231
-
232
-
233
-
234
-
235
-
236
-
237
-
238
-
239
-
240
-
241
-
242
-
243
-
244
-
245
-
246
-
247
-
248
-
249
-
250
-
251
-
252
-
253
-
254
-
255
-
256
-
257
-
258
-
259
-
260
-
261
-
262
-
263
-
264
-
265
-
266
-
267
-
268
 |
 |

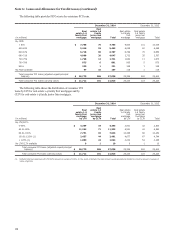
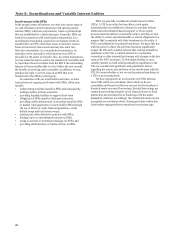
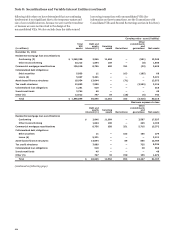
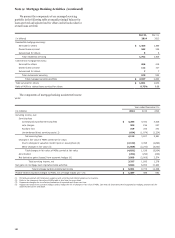
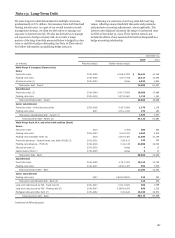
Note 8: Securitizations and Variable Interest Entities (continued)
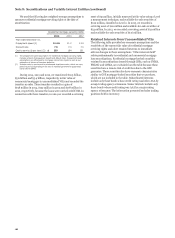
In addition to residential mortgage servicing rights (MSRs)
included in the previous table, we have a small portfolio of
commercial MSRs with a fair value of $1.6 billion at both
December 31, 2014 and 2013. The nature of our commercial
MSRs, which are carried at LOCOM, is different from our
residential MSRs. Prepayment activity on serviced loans does
not significantly impact the value of commercial MSRs because,
unlike residential mortgages, commercial mortgages experience
significantly lower prepayments due to certain contractual
restrictions, impacting the borrower’s ability to prepay the
mortgage. Additionally, for our commercial MSR portfolio, we
are typically master/primary servicer, but not the special
servicer, who is separately responsible for the servicing and
workout of delinquent and foreclosed loans. It is the special
servicer, similar to our role as servicer of residential mortgage
loans, who is affected by higher servicing and foreclosure costs
due to an increase in delinquent and foreclosed loans.
Accordingly, prepayment speeds and costs to service are not key
assumptions for commercial MSRs as they do not significantly
impact the valuation. The primary economic driver impacting
the fair value of our commercial MSRs is forward interest rates,
which are derived from market observable yield curves used to
price capital markets instruments. Market interest rates most
significantly affect interest earned on custodial deposit balances.
The sensitivity of the current fair value to an immediate adverse
25% change in the assumption about interest earned on deposit
balances at December 31, 2014, and 2013, results in a decrease in
fair value of $185 million and $175 million, respectively. See
Note 9 (Mortgage Banking Activities) for further information on
our commercial MSRs.
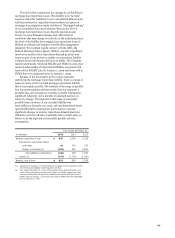
We also have a $6.5 billion loan to an unconsolidated third
party VIE that we extended in fourth quarter 2014 in
conjunction with our sale of government guaranteed student
loans. The loan is carried at amortized cost and approximates
fair value at December 31, 2014. The estimated fair value of the
loan is considered a Level 3 measurement that is determined
using discounted cash flows that are based on changes in the
discount rate due to changes in the risk premium component
(credit spreads). The primary economic assumption impacting
the fair value of our loan is the discount rate. Changes in the
credit loss assumption are not expected to affect the estimated
fair value of the loan due to the government guarantee of the
underlying collateral. The sensitivity of the current fair value to
an immediate adverse increase of 200 basis points in the risk
premium component of the discount rate assumption is a
decrease in fair value of $130 million at December 31, 2014. For
more information on the student loan sale, see the discussion on
Asset-Based Finance Structures earlier in this Note.
The sensitivities in the preceding paragraphs and table are
hypothetical and caution should be exercised when relying on
this data. Changes in value based on variations in assumptions
generally cannot be extrapolated because the relationship of the
change in the assumption to the change in value may not be
linear. Also, the effect of a variation in a particular assumption
on the value of the other interests held is calculated
independently without changing any other assumptions. In
reality, changes in one factor may result in changes in others (for
example, changes in prepayment speed estimates could result in
changes in the credit losses), which might magnify or counteract
the sensitivities.
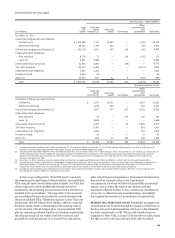
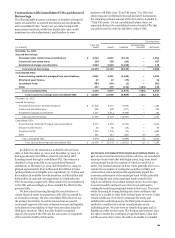
Off-Balance Sheet Loans
The following table presents information about the principal
balances of off-balance sheet loans that were sold or securitized,
including residential mortgage loans sold to FNMA, FHLMC,
GNMA and other investors, for which we have some form of
continuing involvement (primarily servicer). Delinquent loans
include loans 90 days or more past due and loans in bankruptcy,
regardless of delinquency status. For loans sold or securitized
where servicing is our only form of continuing involvement, we
would only experience a loss if we were required to repurchase a
delinquent loan or foreclosed asset due to a breach in
representations and warranties associated with our loan sale or
servicing contracts.
Net charge-offs
Delinquent loans and
Total loans foreclosed assets (1) Year ended
December 31, December 31, December 31,
(in millions) 2014 2013 2014 2013 2014 2013
Commercial:
Real estate mortgage 114,081 119,346 7,949 8,808 621
Total commercial 114,081 119,346 7,949 8,808 621
Consumer:
Real estate 1-4 family first mortgage (2)(3) 1,322,136 1,387,822 28,639 32,911 1,209 2,318
Real estate 1-4 family junior lien mortgage 1 1 — — — —
Other revolving credit and installment 1,599 1,790 75 99 1 —
Total consumer 1,323,736 1,389,613 28,714 33,010 1,210 2,318
Total off-balance sheet sold or securitized loans (4) $ 1,437,817 1,508,959 36,663 41,818 1,831 2,935
(1) Includes $3.3 billion and $2.8 billion of commercial foreclosed assets and $2.7 billion and $3.9 billion of consumer foreclosed assets at December 31, 2014 and 2013,
respectively.
(2) Total loans in prior period have been revised to include whole loan sales for which we have some form of continuing involvement.
(3) Delinquent loans and foreclosed assets in prior period have been revised to include whole loan sale delinquencies and transferred assets in foreclosure status for which we
have risk of loss. The related net charge-offs have also been revised.
(4) At December 31, 2014 and 2013, the table includes total loans of $1.3 trillion at both dates and delinquent loans of $16.5 billion and $17.9 billion, respectively for FNMA,
FHLMC and GNMA. Net charge-offs exclude loans sold to FNMA, FHLMC and GNMA as we do not service or manage the underlying real estate upon foreclosure and, as such,
do not have access to net charge-off information.
617
617
188