Wells Fargo 2014 Annual Report Download - page 244
Download and view the complete annual report
Please find page 244 of the 2014 Wells Fargo annual report below. You can navigate through the pages in the report by either clicking on the pages listed below, or by using the keyword search tool below to find specific information within the annual report.-
 1
1 -
2
-
3
-
4
-
5
-
6
-
7
-
8
-
9
-
10
-
11
-
12
-
13
-
14
-
15
-
16
-
17
-
18
-
19
-
20
-
21
-
22
-
23
-
24
-
25
-
26
-
27
-
28
-
29
-
30
-
31
-
32
-
33
-
34
-
35
-
36
-
37
-
38
-
39
-
40
-
41
-
42
-
43
-
44
-
45
-
46
-
47
-
48
-
49
-
50
-
51
-
52
-
53
-
54
-
55
-
56
-
57
-
58
-
59
-
60
-
61
-
62
-
63
-
64
-
65
-
66
-
67
-
68
-
69
-
70
-
71
-
72
-
73
-
74
-
75
-
76
-
77
-
78
-
79
-
80
-
81
-
82
-
83
-
84
-
85
-
86
-
87
-
88
-
89
-
90
-
91
-
92
-
93
-
94
-
95
-
96
-
97
-
98
-
99
-
100
-
101
-
102
-
103
-
104
-
105
-
106
-
107
-
108
-
109
-
110
-
111
-
112
-
113
-
114
-
115
-
116
-
117
-
118
-
119
-
120
-
121
-
122
-
123
-
124
-
125
-
126
-
127
-
128
-
129
-
130
-
131
-
132
-
133
-
134
-
135
-
136
-
137
-
138
-
139
-
140
-
141
-
142
-
143
-
144
-
145
-
146
-
147
-
148
-
149
-
150
-
151
-
152
-
153
-
154
-
155
-
156
-
157
-
158
-
159
-
160
-
161
-
162
-
163
-
164
-
165
-
166
-
167
-
168
-
169
-
170
-
171
-
172
-
173
-
174
-
175
-
176
-
177
-
178
-
179
-
180
-
181
-
182
-
183
-
184
-
185
-
186
-
187
-
188
-
189
-
190
-
191
-
192
-
193
-
194
-
195
-
196
-
197
-
198
-
199
-
200
-
201
-
202
-
203
-
204
-
205
-
206
-
207
-
208
-
209
-
210
-
211
-
212
-
213
-
214
-
215
-
216
-
217
-
218
-
219
-
220
-
221
-
222
-
223
-
224
-
225
-
226
-
227
-
228
-
229
-
230
-
231
-
232
-
233
-
 234
234 -
 235
235 -
 236
236 -
 237
237 -
 238
238 -
 239
239 -
 240
240 -
 241
241 -
 242
242 -
 243
243 -
 244
244 -
 245
245 -
 246
246 -
 247
247 -
 248
248 -
 249
249 -
 250
250 -
 251
251 -
 252
252 -
 253
253 -
 254
254 -
255
-
256
-
257
-
258
-
259
-
260
-
261
-
262
-
263
-
264
-
265
-
266
-
267
-
268
 |
 |

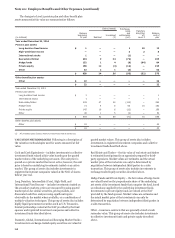
Note 20: Employee Benefits and Other Expenses
Pension and Postretirement Plans
We sponsor a frozen noncontributory qualified defined benefit
retirement plan called the Wells Fargo & Company Cash Balance
Plan (Cash Balance Plan), which covers eligible employees of
Wells Fargo. The Cash Balance Plan was frozen on July 1, 2009
and no new benefits accrue after that date.
Prior to July 1, 2009, eligible employees' Cash Balance Plan
accounts were allocated a compensation credit based on a
percentage of their certified compensation; the freeze
discontinued the allocation of compensation credits after June
30, 2009. Investment credits continue to be allocated to
participants based on their accumulated balances.
We recognize settlement losses for our Cash Balance Plan
based on an assessment of whether our estimated lump sum
payments related to the Cash Balance Plan will, in aggregate for
the year, exceed the sum of its annual service and interest cost
(threshold). Lump sum payments did not exceed this threshold
in 2014. In 2013, lump sum payments exceeded this threshold.
Settlement losses of $123 million were recognized in 2013,
representing the pro rata portion of the net loss remaining in
cumulative other comprehensive income based on the
percentage reduction in the Cash Balance Plan’s projected
benefit obligation. A remeasurement of the Cash Balance liability
and related plan assets occurs at the end of each quarter in
which settlement losses are recognized.
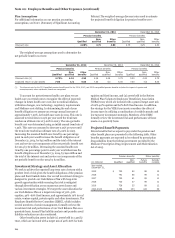
We did not make a contribution to our Cash Balance Plan in
2014. We do not expect that we will be required to make a
contribution to the Cash Balance Plan in 2015; however, this is
dependent on the finalization of the actuarial valuation in 2015.
Our decision of whether to make a contribution in 2015 will be
based on various factors including the actual investment
performance of plan assets during 2015. Given these
uncertainties, we cannot estimate at this time the amount, if any,
that we will contribute in 2015 to the Cash Balance Plan. For the
nonqualified pension plans and postretirement benefit plans,
there is no minimum required contribution beyond the amount
needed to fund benefit payments; we may contribute more to our
postretirement benefit plans dependent on various factors.
We provide health care and life insurance benefits for
certain retired employees and reserve the right to terminate,
modify or amend any of the benefits at any time.
The information set forth in the following tables is based on
current actuarial reports using the measurement date of
December 31 for our pension and postretirement benefit plans.
In October 2014, the Society of Actuaries (SOA) published
updated mortality tables that reflect improved longevity. The
benefit obligations at December 31, 2014 reflect the SOA's
updated mortality tables, which did not have a material effect on
these obligations.
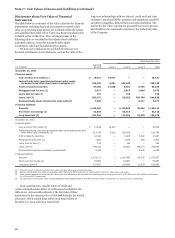
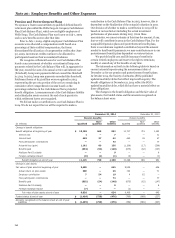
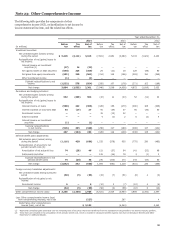
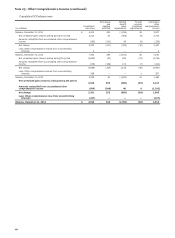
The changes in the benefit obligation and the fair value of
plan assets, the funded status and the amounts recognized on
the balance sheet were:
December 31, 2014 December 31, 2013
Pension benefits Pension benefits
Non- Other Non- Other
(in millions) Qualified qualified benefits Qualified qualified benefits
Change in benefit obligation:
Benefit obligation at beginning of year $ 10,198 669 982 11,717 719 1,293
Service cost 1 — 7 — — 11
Interest cost 465 27 42 465 29 47
Plan participants’ contributions — — 73 — — 77
Actuarial loss (gain) 1,161 89 136 (1,106) (17) (306)
Benefits paid (692) (54) (148) (875) (62) (147)
Medicare Part D subsidy — — 9 — — 8
Foreign exchange impact (8) (1) (1) (3) — (1)
Benefit obligation at end of year 11,125 730 1,100 10,198 669 982
Change in plan assets:
Fair value of plan assets at beginning of year 9,409 — 645 9,539 — 636
Actual return on plan assets 909 — 26 743 — 71
Employer contribution 7 54 19 4 62 —
Plan participants’ contributions — — 73 — — 77
Benefits paid (692) (54) (148) (875) (62) (147)
Medicare Part D subsidy — — 9 — — 8
Foreign exchange impact (7) — — (2) — —
Fair value of plan assets at end of year 9,626 — 624 9,409 — 645
Funded status at end of year $ (1,499) (730) (476) (789) (669) (337)
Amounts recognized on the balance sheet at end of year:
Liabilities $ (1,499) (730) (476) (789) (669) (337)
242