Wells Fargo 2014 Annual Report Download - page 258
Download and view the complete annual report
Please find page 258 of the 2014 Wells Fargo annual report below. You can navigate through the pages in the report by either clicking on the pages listed below, or by using the keyword search tool below to find specific information within the annual report.-
 1
1 -
2
-
3
-
4
-
5
-
6
-
7
-
8
-
9
-
10
-
11
-
12
-
13
-
14
-
15
-
16
-
17
-
18
-
19
-
20
-
21
-
22
-
23
-
24
-
25
-
26
-
27
-
28
-
29
-
30
-
31
-
32
-
33
-
34
-
35
-
36
-
37
-
38
-
39
-
40
-
41
-
42
-
43
-
44
-
45
-
46
-
47
-
48
-
49
-
50
-
51
-
52
-
53
-
54
-
55
-
56
-
57
-
58
-
59
-
60
-
61
-
62
-
63
-
64
-
65
-
66
-
67
-
68
-
69
-
70
-
71
-
72
-
73
-
74
-
75
-
76
-
77
-
78
-
79
-
80
-
81
-
82
-
83
-
84
-
85
-
86
-
87
-
88
-
89
-
90
-
91
-
92
-
93
-
94
-
95
-
96
-
97
-
98
-
99
-
100
-
101
-
102
-
103
-
104
-
105
-
106
-
107
-
108
-
109
-
110
-
111
-
112
-
113
-
114
-
115
-
116
-
117
-
118
-
119
-
120
-
121
-
122
-
123
-
124
-
125
-
126
-
127
-
128
-
129
-
130
-
131
-
132
-
133
-
134
-
135
-
136
-
137
-
138
-
139
-
140
-
141
-
142
-
143
-
144
-
145
-
146
-
147
-
148
-
149
-
150
-
151
-
152
-
153
-
154
-
155
-
156
-
157
-
158
-
159
-
160
-
161
-
162
-
163
-
164
-
165
-
166
-
167
-
168
-
169
-
170
-
171
-
172
-
173
-
174
-
175
-
176
-
177
-
178
-
179
-
180
-
181
-
182
-
183
-
184
-
185
-
186
-
187
-
188
-
189
-
190
-
191
-
192
-
193
-
194
-
195
-
196
-
197
-
198
-
199
-
200
-
201
-
202
-
203
-
204
-
205
-
206
-
207
-
208
-
209
-
210
-
211
-
212
-
213
-
214
-
215
-
216
-
217
-
218
-
219
-
220
-
221
-
222
-
223
-
224
-
225
-
226
-
227
-
228
-
229
-
230
-
231
-
232
-
233
-
234
-
235
-
236
-
237
-
238
-
239
-
240
-
241
-
242
-
243
-
244
-
245
-
246
-
247
-
 248
248 -
 249
249 -
 250
250 -
 251
251 -
 252
252 -
 253
253 -
 254
254 -
 255
255 -
 256
256 -
 257
257 -
 258
258 -
 259
259 -
 260
260 -
 261
261 -
 262
262 -
 263
263 -
 264
264 -
 265
265 -
 266
266 -
 267
267 -
 268
268
 |
 |

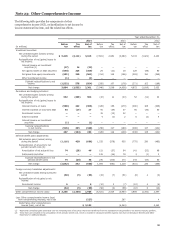
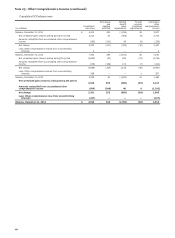
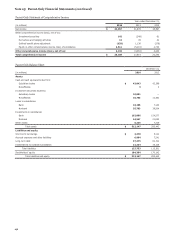
Note 25: Parent-Only Financial Statements (continued)
Parent-Only Statement of Comprehensive Income
Year ended December 31,
(in millions) 2014 2013 2012
Net income $ 23,057 21,878 18,897
Other comprehensive income (loss), net of tax:
Investment securities 142 (248) 61
Derivatives and hedging activities 12 39 31
Defined benefit plans adjustment (633) 1,136 (379)
Equity in other comprehensive income (loss) of subsidiaries 2,611 (5,191) 2,730
Other comprehensive income (loss), net of tax: 2,132 (4,264) 2,443
Total comprehensive income $ 25,189 17,614 21,340
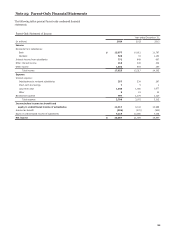
Parent-Only Balance Sheet
December 31,
(in millions) 2014 2013
Assets
Cash and cash equivalents due from:
Subsidiary banks $ 43,843 42,386
Nonaffiliates 3 3
Investment securities issued by:
Subsidiary banks 10,001 —
Nonaffiliates 10,753 11,652
Loans to subsidiaries:
Bank 18,166 7,140
Nonbank 35,783 38,504
Investments in subsidiaries:
Bank 162,806 154,577
Nonbank 24,567 21,852
Other assets 6,225 7,329
Total assets $ 312,147 283,443
Liabilities and equity
Short-term borrowings $ 2,270 5,121
Accrued expenses and other liabilities 6,984 7,241
Long-term debt 97,275 81,721
Indebtedness to nonbank subsidiaries 21,224 19,218
Total liabilities 127,753 113,301
Stockholders' equity 184,394 170,142
Total liabilities and equity $ 312,147 283,443
256