Wells Fargo 2014 Annual Report Download - page 263
Download and view the complete annual report
Please find page 263 of the 2014 Wells Fargo annual report below. You can navigate through the pages in the report by either clicking on the pages listed below, or by using the keyword search tool below to find specific information within the annual report.-
 1
1 -
2
-
3
-
4
-
5
-
6
-
7
-
8
-
9
-
10
-
11
-
12
-
13
-
14
-
15
-
16
-
17
-
18
-
19
-
20
-
21
-
22
-
23
-
24
-
25
-
26
-
27
-
28
-
29
-
30
-
31
-
32
-
33
-
34
-
35
-
36
-
37
-
38
-
39
-
40
-
41
-
42
-
43
-
44
-
45
-
46
-
47
-
48
-
49
-
50
-
51
-
52
-
53
-
54
-
55
-
56
-
57
-
58
-
59
-
60
-
61
-
62
-
63
-
64
-
65
-
66
-
67
-
68
-
69
-
70
-
71
-
72
-
73
-
74
-
75
-
76
-
77
-
78
-
79
-
80
-
81
-
82
-
83
-
84
-
85
-
86
-
87
-
88
-
89
-
90
-
91
-
92
-
93
-
94
-
95
-
96
-
97
-
98
-
99
-
100
-
101
-
102
-
103
-
104
-
105
-
106
-
107
-
108
-
109
-
110
-
111
-
112
-
113
-
114
-
115
-
116
-
117
-
118
-
119
-
120
-
121
-
122
-
123
-
124
-
125
-
126
-
127
-
128
-
129
-
130
-
131
-
132
-
133
-
134
-
135
-
136
-
137
-
138
-
139
-
140
-
141
-
142
-
143
-
144
-
145
-
146
-
147
-
148
-
149
-
150
-
151
-
152
-
153
-
154
-
155
-
156
-
157
-
158
-
159
-
160
-
161
-
162
-
163
-
164
-
165
-
166
-
167
-
168
-
169
-
170
-
171
-
172
-
173
-
174
-
175
-
176
-
177
-
178
-
179
-
180
-
181
-
182
-
183
-
184
-
185
-
186
-
187
-
188
-
189
-
190
-
191
-
192
-
193
-
194
-
195
-
196
-
197
-
198
-
199
-
200
-
201
-
202
-
203
-
204
-
205
-
206
-
207
-
208
-
209
-
210
-
211
-
212
-
213
-
214
-
215
-
216
-
217
-
218
-
219
-
220
-
221
-
222
-
223
-
224
-
225
-
226
-
227
-
228
-
229
-
230
-
231
-
232
-
233
-
234
-
235
-
236
-
237
-
238
-
239
-
240
-
241
-
242
-
243
-
244
-
245
-
246
-
247
-
248
-
249
-
250
-
251
-
252
-
 253
253 -
 254
254 -
 255
255 -
 256
256 -
 257
257 -
 258
258 -
 259
259 -
 260
260 -
 261
261 -
 262
262 -
 263
263 -
 264
264 -
 265
265 -
 266
266 -
 267
267 -
 268
268
 |
 |

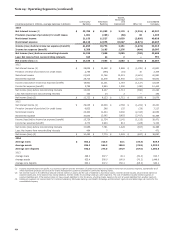
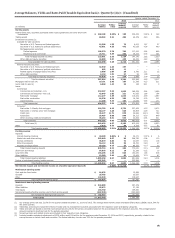
Average Balances, Yields and Rates Paid (Taxable-Equivalent basis) - Quarterly (1)(2) - (Unaudited)
Quarter ended December 31,
2014 2013
Interest Interest
Average Yields/ income/ Average Yields/ income/
(in millions) balance rates expense balance rates expense
Earning assets
Federal funds sold, securities purchased under resale agreements and other short-term
investments $ 268,109 0.28% $ 188 205,276 0.28% $ 148
Trading assets 60,383 3.21 485 45,379 3.40 386
Investment securities (3):
Available-for-sale securities:
Securities of U.S. Treasury and federal agencies 19,506 1.55 76 6,611 1.67 27
Securities of U.S. states and political subdivisions 43,891 4.30 472 42,025 4.38 460
Mortgage-backed securities:
Federal agencies 109,270 2.78 760 117,910 2.94 866
Residential and commercial 24,711 5.89 364 29,233 6.35 464
Total mortgage-backed securities 133,981 3.36 1,124 147,143 3.62 1,330
Other debt and equity securities 44,980 3.87 438 55,325 3.43 478
Total available-for-sale securities 242,358 3.48 2,110 251,104 3.65 2,295
Held-to-maturity securities:
Securities of U.S. Treasury and federal agencies 32,930 2.25 187 — — —
Securities of U.S. states and political subdivisions 902 4.92 11 — — —
Federal agency mortgage-backed securities 5,586 2.07 29 2,780 3.11 22
Other debt securities 6,118 1.81 27 65 1.99 —
Total held-to-maturity securities 45,536 2.22 254 2,845 3.09 22
Total investment securities 287,894 3.28 2,364 253,949 3.65 2,317
Mortgages held for sale (4) 19,191 3.90 187 21,396 4.13 221
Loans held for sale (4) 6,968 1.43 25 138 8.21 3
Loans:
Commercial:
Commercial and industrial - U.S. 218,297 3.32 1,825 189,939 3.54 1,696
Commercial and industrial - Non U.S. 43,049 2.03 221 41,062 1.88 194
Real estate mortgage 112,277 3.69 1,044 110,674 3.90 1,087
Real estate construction 18,336 4.33 200 16,744 4.76 201
Lease financing 12,268 5.35 164 12,085 5.68 171
Total commercial 404,227 3.39 3,454 370,504 3.59 3,349
Consumer:
Real estate 1-4 family first mortgage 264,799 4.16 2,754 257,265 4.15 2,672
Real estate 1-4 family junior lien mortgage 60,177 4.28 648 66,809 4.29 721
Credit card 29,477 11.71 870 25,865 12.23 798
Automobile 55,457 6.08 849 50,213 6.70 849
Other revolving credit and installment 35,292 6.01 534 42,662 4.94 531
Total consumer
Total loans (4)
445,202
849,429
5.06
4.27
5,655
9,109
442,814
813,318
5.01
4.36
5,571
8,920
Other
Total earning assets
4,829
$ 1,496,803
5.30
3.31%
64
$ 12,422
4,728
1,344,184
5.22
3.57%
61
$ 12,056
Funding sources
Deposits:
Interest-bearing checking $ 40,498 0.06% $ 6 35,171 0.07% $ 6
Market rate and other savings 593,940 0.07 99 568,750 0.08 110
Savings certificates 35,870 0.80 72 43,067 0.94 102
Other time deposits 56,119 0.39 55 39,700 0.48 47
Deposits in foreign offices 99,289 0.15 37 86,333 0.15 32
Total interest-bearing deposits 825,716 0.13 269 773,021 0.15 297
Short-term borrowings 64,676 0.12 19 52,286 0.12 15
Long-term debt 183,286 1.35 620 153,470 1.65 635
Other liabilities 15,580 2.44
0.37
—
0.27
3.04%
96
1,004
—
1,004
$ 11,418
12,822
991,599
352,585
1,344,184
15,998
25,637
119,947
2.70
0.42
—
0.30
3.27%
87
1,034
—
1,034
$ 11,022
Total interest-bearing liabilities
Portion of noninterest-bearing funding sources
Total funding sources
Net interest margin and net interest income on a taxable-equivalent basis (5)
Noninterest-earning assets
Cash and due from banks
Goodwill
Other
1,089,258
407,545
$ 1,496,803
$ 16,932
25,705
124,320
Total noninterest-earning assets $ 166,957 161,582
Noninterest-bearing funding sources
Deposits $ 324,080 287,379
Other liabilities 65,672 57,138
Total equity 184,750 169,650
Noninterest-bearing funding sources used to fund earning assets (407,545) (352,585)
Net noninterest-bearing funding sources $ 166,957 161,582
Total assets $ 1,663,760 1,505,766
(1) Our average prime rate was 3.25% for the quarters ended December 31, 2014 and 2013. The average three-month London Interbank Offered Rate (LIBOR) was 0.24% for
the same quarters.
(2) Yield/rates and amounts include the effects of hedge and risk management activities associated with the respective asset and liability categories.
(3) Yields and rates are based on interest income/expense amounts for the period, annualized based on the accrual basis for the respective accounts. The average balance
amounts represent amortized cost for the periods presented.
(4) Nonaccrual loans and related income are included in their respective loan categories.
(5) Includes taxable-equivalent adjustments of $238 million and $219 million for the quarters ended December 31, 2014 and 2013, respectively, primarily related to tax-
exempt income on certain loans and securities. The federal statutory tax rate was 35% for the periods presented.
261