Wells Fargo 2014 Annual Report Download - page 98
Download and view the complete annual report
Please find page 98 of the 2014 Wells Fargo annual report below. You can navigate through the pages in the report by either clicking on the pages listed below, or by using the keyword search tool below to find specific information within the annual report.-
 1
1 -
2
-
3
-
4
-
5
-
6
-
7
-
8
-
9
-
10
-
11
-
12
-
13
-
14
-
15
-
16
-
17
-
18
-
19
-
20
-
21
-
22
-
23
-
24
-
25
-
26
-
27
-
28
-
29
-
30
-
31
-
32
-
33
-
34
-
35
-
36
-
37
-
38
-
39
-
40
-
41
-
42
-
43
-
44
-
45
-
46
-
47
-
48
-
49
-
50
-
51
-
52
-
53
-
54
-
55
-
56
-
57
-
58
-
59
-
60
-
61
-
62
-
63
-
64
-
65
-
66
-
67
-
68
-
69
-
70
-
71
-
72
-
73
-
74
-
75
-
76
-
77
-
78
-
79
-
80
-
81
-
82
-
83
-
84
-
85
-
86
-
87
-
 88
88 -
 89
89 -
 90
90 -
 91
91 -
 92
92 -
 93
93 -
 94
94 -
 95
95 -
 96
96 -
 97
97 -
 98
98 -
 99
99 -
 100
100 -
 101
101 -
 102
102 -
 103
103 -
 104
104 -
 105
105 -
 106
106 -
 107
107 -
 108
108 -
109
-
110
-
111
-
112
-
113
-
114
-
115
-
116
-
117
-
118
-
119
-
120
-
121
-
122
-
123
-
124
-
125
-
126
-
127
-
128
-
129
-
130
-
131
-
132
-
133
-
134
-
135
-
136
-
137
-
138
-
139
-
140
-
141
-
142
-
143
-
144
-
145
-
146
-
147
-
148
-
149
-
150
-
151
-
152
-
153
-
154
-
155
-
156
-
157
-
158
-
159
-
160
-
161
-
162
-
163
-
164
-
165
-
166
-
167
-
168
-
169
-
170
-
171
-
172
-
173
-
174
-
175
-
176
-
177
-
178
-
179
-
180
-
181
-
182
-
183
-
184
-
185
-
186
-
187
-
188
-
189
-
190
-
191
-
192
-
193
-
194
-
195
-
196
-
197
-
198
-
199
-
200
-
201
-
202
-
203
-
204
-
205
-
206
-
207
-
208
-
209
-
210
-
211
-
212
-
213
-
214
-
215
-
216
-
217
-
218
-
219
-
220
-
221
-
222
-
223
-
224
-
225
-
226
-
227
-
228
-
229
-
230
-
231
-
232
-
233
-
234
-
235
-
236
-
237
-
238
-
239
-
240
-
241
-
242
-
243
-
244
-
245
-
246
-
247
-
248
-
249
-
250
-
251
-
252
-
253
-
254
-
255
-
256
-
257
-
258
-
259
-
260
-
261
-
262
-
263
-
264
-
265
-
266
-
267
-
268
 |
 |

Risk Management - Asset/Liability Management (continued)
ensuring significant unobservable model inputs are appropriate
given observable market transactions or other market data
within the same or similar asset classes. This ensures modeled
approaches are appropriate given similar product valuation
techniques and are in line with their intended purpose. The
Corporate Model Risk Group provides oversight of model
validation and assessment processes.
All internal valuation models are subject to ongoing review
by business-unit-level management, and all models are subject
to additional oversight by a corporate-level risk management
department. Corporate oversight responsibilities include
evaluating the adequacy of business unit risk management
programs, maintaining company-wide model validation policies
and standards, and reporting the results of these activities to
management.
MARKET RISK - EQUITY INVESTMENTS We are directly and
indirectly affected by changes in the equity markets. We make
and manage direct equity investments in start-up businesses,
emerging growth companies, management buy-outs,
acquisitions and corporate recapitalizations. We also invest in
non-affiliated funds that make similar private equity
investments. These private equity investments are made within
capital allocations approved by management and the Board. The
Board’s policy is to review business developments, key risks and
historical returns for the private equity investment portfolio at
least annually. Management reviews these investments at least
quarterly and assesses them for possible OTTI. For
nonmarketable investments, the analysis is based on facts and
circumstances of each individual investment and the
expectations for that investment’s cash flows and capital needs,
the viability of its business model and our exit strategy.
Nonmarketable investments include private equity investments
accounted for under the cost method, equity method and fair
value option.
As part of our business to support our customers, we trade
public equities, listed/OTC equity derivatives and convertible
bonds. We have parameters that govern these activities. We also
have marketable equity securities in the available-for-sale
securities portfolio, including securities relating to our venture
capital activities. We manage these investments within capital
risk limits approved by management and the Board and
monitored by Corporate ALCO. Gains and losses on these
securities are recognized in net income when realized and
periodically include OTTI charges.
Changes in equity market prices may also indirectly affect
our net income by (1) the value of third party assets under
management and, hence, fee income, (2) borrowers whose
ability to repay principal and/or interest may be affected by the
stock market, or (3) brokerage activity, related commission
income and other business activities. Each business line
monitors and manages these indirect risks.
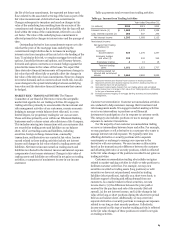
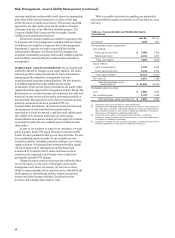
Table 54 provides information regarding our marketable
and nonmarketable equity investments as of December 31, 2014
and 2013.
Table 54: Nonmarketable and Marketable Equity
Investments
Dec 31, Dec 31,
(in millions) 2014 2013
Nonmarketable equity investments:
Cost method:
Private equity and other $ 2,300 2,308
Federal bank stock 4,733 4,670
Total cost method 7,033 6,978
Equity method:
LIHTC investments (1) 7,278 6,209
Private equity and other 5,132 5,782
Total equity method 12,410 11,991
Fair value (2) 2,512 1,386
Total nonmarketable equity
investments (3) $ 21,955 20,355
Marketable equity securities:
Cost $ 1,906 2,039
Net unrealized gains 1,770 1,346
Total marketable equity securities (4) $ 3,676 3,385
(1) Represents low income housing tax credit investments.
(2) Represents nonmarketable equity investments for which we have elected the
fair value option. See Note 7 (Premises, Equipment, Lease Commitments and
Other Assets) and Note 17 (Fair Values of Assets and Liabilities) to Financial
Statements in this Report for additional information.
(3) Included in other assets on the balance sheet. See Note 7 (Premises,
Equipment, Lease Commitments and Other Assets) to Financial Statements in
this Report for additional information.
(4) Included in available-for-sale securities. See Note 5 (Investment Securities) to
Financial Statements in this Report for additional information.
96