Wells Fargo 2014 Annual Report Download - page 41
Download and view the complete annual report
Please find page 41 of the 2014 Wells Fargo annual report below. You can navigate through the pages in the report by either clicking on the pages listed below, or by using the keyword search tool below to find specific information within the annual report.-
 1
1 -
2
-
3
-
4
-
5
-
6
-
7
-
8
-
9
-
10
-
11
-
12
-
13
-
14
-
15
-
16
-
17
-
18
-
19
-
20
-
21
-
22
-
23
-
24
-
25
-
26
-
27
-
28
-
29
-
30
-
 31
31 -
 32
32 -
 33
33 -
 34
34 -
 35
35 -
 36
36 -
 37
37 -
 38
38 -
 39
39 -
 40
40 -
 41
41 -
 42
42 -
 43
43 -
 44
44 -
 45
45 -
 46
46 -
 47
47 -
 48
48 -
 49
49 -
 50
50 -
 51
51 -
52
-
53
-
54
-
55
-
56
-
57
-
58
-
59
-
60
-
61
-
62
-
63
-
64
-
65
-
66
-
67
-
68
-
69
-
70
-
71
-
72
-
73
-
74
-
75
-
76
-
77
-
78
-
79
-
80
-
81
-
82
-
83
-
84
-
85
-
86
-
87
-
88
-
89
-
90
-
91
-
92
-
93
-
94
-
95
-
96
-
97
-
98
-
99
-
100
-
101
-
102
-
103
-
104
-
105
-
106
-
107
-
108
-
109
-
110
-
111
-
112
-
113
-
114
-
115
-
116
-
117
-
118
-
119
-
120
-
121
-
122
-
123
-
124
-
125
-
126
-
127
-
128
-
129
-
130
-
131
-
132
-
133
-
134
-
135
-
136
-
137
-
138
-
139
-
140
-
141
-
142
-
143
-
144
-
145
-
146
-
147
-
148
-
149
-
150
-
151
-
152
-
153
-
154
-
155
-
156
-
157
-
158
-
159
-
160
-
161
-
162
-
163
-
164
-
165
-
166
-
167
-
168
-
169
-
170
-
171
-
172
-
173
-
174
-
175
-
176
-
177
-
178
-
179
-
180
-
181
-
182
-
183
-
184
-
185
-
186
-
187
-
188
-
189
-
190
-
191
-
192
-
193
-
194
-
195
-
196
-
197
-
198
-
199
-
200
-
201
-
202
-
203
-
204
-
205
-
206
-
207
-
208
-
209
-
210
-
211
-
212
-
213
-
214
-
215
-
216
-
217
-
218
-
219
-
220
-
221
-
222
-
223
-
224
-
225
-
226
-
227
-
228
-
229
-
230
-
231
-
232
-
233
-
234
-
235
-
236
-
237
-
238
-
239
-
240
-
241
-
242
-
243
-
244
-
245
-
246
-
247
-
248
-
249
-
250
-
251
-
252
-
253
-
254
-
255
-
256
-
257
-
258
-
259
-
260
-
261
-
262
-
263
-
264
-
265
-
266
-
267
-
268
 |
 |

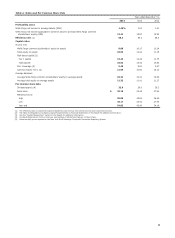
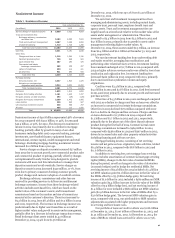
2012 2011 2010
Interest Interest Interest
Average
balance Yields/
rates income/
expense Average
balance Yields/
rates income/
expense Average
balance Yields/
rates income/
expense
$ 84,081 0.45% $ 378 87,186 0.40% $ 345 62,961 0.36% $ 230
41,950 3.29 1,380 39,737 3.68 1,463 29,920 3.75 1,121
3,604 1.31 47 5,503 1.25 69 1,870 3.24 61
34,875 4.48 1,561 24,035 5.09 1,223 16,089 6.09 980
92,887 3.12 2,893 74,665 4.36 3,257 71,953 5.14 3,697
33,545 6.75 2,264 31,902 8.20 2,617 31,815 10.67 3,396
126,432 4.08 5,157 106,567 5.51 5,874 103,768 6.84 7,093
49,245 4.04 1,992 38,625 5.03 1,941 32,611 6.45 2,102
214,156 4.09 8,757 174,730 5.21 9,107 154,338 6.63 10,236
— — — — — — — — —
— — — — — — — — —
— — — — — — — — —
— — — — — — — — —
— — — — — — — — —
214,156 4.09 8,757 174,730 5.21 9,107 154,338 6.63 10,236
48,955 3.73 1,825 37,232 4.42 1,644 36,716 4.73 1,736
661 6.22 41 1,104 5.25 58 3,773 2.67 101
173,913 4.01 6,981 157,608 4.37 6,894 149,576 4.80 7,186
38,838 2.34 910 35,042 2.13 745 27,176 2.53 688
105,492 4.19 4,416 102,320 4.07 4,167 98,558 3.90 3,839
18,047 4.97 897 21,672 4.88 1,057 31,306 3.36 1,052
13,067 7.18 939 13,223 7.52 994 13,735 9.16 1,258
349,357 4.05 14,143 329,865 4.20 13,857 320,351 4.38 14,023
235,011 4.55 10,704 227,676 4.90 11,156 236,673 5.21 12,321
80,887 4.28 3,460 90,755 4.33 3,930 101,598 4.45 4,525
22,809 12.68 2,892 21,556 13.04 2,811 22,542 13.38 3,017
44,986 7.54 3,390 43,834 8.14 3,568 43,986 8.88 3,905
42,174 4.57 1,928 43,458 4.56 1,980 45,451 4.44 2,017
425,867 5.25 22,374 427,279 5.49 23,445 450,250 5.73 25,785
775,224 4.71 36,517 757,144 4.93 37,302 770,601 5.17 39,808
4,438 4.70 209 4,929 4.12 203 5,849 3.56 207
$ 1,169,465 4.20% $ 49,107 1,102,062 4.55% $ 50,122 1,064,158 5.02% $ 53,439
$ 30,564 0.06% $ 19 47,705 0.08% $ 40 60,941 0.12% $ 72
505,310 0.12 592 464,450 0.18 836 416,877 0.26 1,088
59,484 1.31 782 69,711 1.43 995 87,133 1.43 1,247
13,363 1.68 225 13,126 2.04 268 14,654 2.07 302
67,920 0.16 109 61,566 0.22 136 55,097 0.22 123
676,641 0.26 1,727 656,558 0.35 2,275 634,702 0.45 2,832
51,196 0.18 94 51,781 0.18 94 46,824 0.22 106
127,547 2.44 3,110 141,079 2.82 3,978 185,426 2.64 4,888
10,032 2.44 245 10,955 2.88 316 6,863 3.31 227
865,416 0.60 5,176 860,373 0.77 6,663 873,815 0.92 8,053
304,049 — — 241,689 — — 190,343 — —
$ 1,169,465 0.44 5,176 1,102,062 0.61 6,663 1,064,158 0.76 8,053
3.76% $ 43,931 3.94% $ 43,459 4.26% $ 45,386
$ 16,303 17,388 17,618
25,417 24,904 24,824
130,450 125,911 120,338
$ 172,170 168,203 162,780
$ 263,863 215,242 183,008
61,214 57,399 47,877
151,142 137,251 122,238
(304,049) (241,689) (190,343)
$ 172,170 168,203 162,780
$ 1,341,635 1,270,265 1,226,938
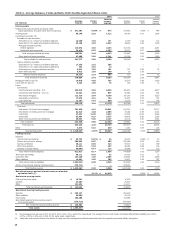
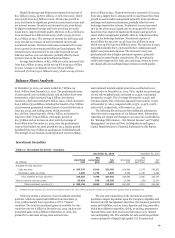
(3) The average balance amounts represent amortized cost for the periods presented.
(4) Nonaccrual loans and related income are included in their respective loan categories.
(5) Includes taxable-equivalent adjustments of $902 million, $792 million, $701 million, $696 million and $629 million for 2014, 2013, 2012, 2011 and 2010, respectively,
primarily related to tax-exempt income on certain loans and securities. The federal statutory tax rate utilized was 35% for the periods presented.
39