Wells Fargo 2014 Annual Report Download - page 95
Download and view the complete annual report
Please find page 95 of the 2014 Wells Fargo annual report below. You can navigate through the pages in the report by either clicking on the pages listed below, or by using the keyword search tool below to find specific information within the annual report.-
 1
1 -
2
-
3
-
4
-
5
-
6
-
7
-
8
-
9
-
10
-
11
-
12
-
13
-
14
-
15
-
16
-
17
-
18
-
19
-
20
-
21
-
22
-
23
-
24
-
25
-
26
-
27
-
28
-
29
-
30
-
31
-
32
-
33
-
34
-
35
-
36
-
37
-
38
-
39
-
40
-
41
-
42
-
43
-
44
-
45
-
46
-
47
-
48
-
49
-
50
-
51
-
52
-
53
-
54
-
55
-
56
-
57
-
58
-
59
-
60
-
61
-
62
-
63
-
64
-
65
-
66
-
67
-
68
-
69
-
70
-
71
-
72
-
73
-
74
-
75
-
76
-
77
-
78
-
79
-
80
-
81
-
82
-
83
-
84
-
 85
85 -
 86
86 -
 87
87 -
 88
88 -
 89
89 -
 90
90 -
 91
91 -
 92
92 -
 93
93 -
 94
94 -
 95
95 -
 96
96 -
 97
97 -
 98
98 -
 99
99 -
 100
100 -
 101
101 -
 102
102 -
 103
103 -
 104
104 -
 105
105 -
106
-
107
-
108
-
109
-
110
-
111
-
112
-
113
-
114
-
115
-
116
-
117
-
118
-
119
-
120
-
121
-
122
-
123
-
124
-
125
-
126
-
127
-
128
-
129
-
130
-
131
-
132
-
133
-
134
-
135
-
136
-
137
-
138
-
139
-
140
-
141
-
142
-
143
-
144
-
145
-
146
-
147
-
148
-
149
-
150
-
151
-
152
-
153
-
154
-
155
-
156
-
157
-
158
-
159
-
160
-
161
-
162
-
163
-
164
-
165
-
166
-
167
-
168
-
169
-
170
-
171
-
172
-
173
-
174
-
175
-
176
-
177
-
178
-
179
-
180
-
181
-
182
-
183
-
184
-
185
-
186
-
187
-
188
-
189
-
190
-
191
-
192
-
193
-
194
-
195
-
196
-
197
-
198
-
199
-
200
-
201
-
202
-
203
-
204
-
205
-
206
-
207
-
208
-
209
-
210
-
211
-
212
-
213
-
214
-
215
-
216
-
217
-
218
-
219
-
220
-
221
-
222
-
223
-
224
-
225
-
226
-
227
-
228
-
229
-
230
-
231
-
232
-
233
-
234
-
235
-
236
-
237
-
238
-
239
-
240
-
241
-
242
-
243
-
244
-
245
-
246
-
247
-
248
-
249
-
250
-
251
-
252
-
253
-
254
-
255
-
256
-
257
-
258
-
259
-
260
-
261
-
262
-
263
-
264
-
265
-
266
-
267
-
268
 |
 |
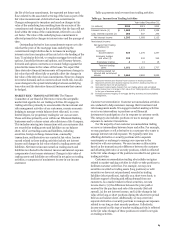
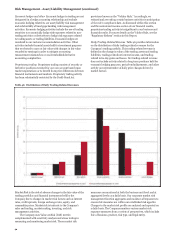
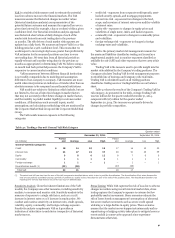
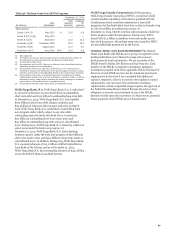
RWA Rollforward Table 49 depicts the changes in the market
risk regulatory capital and RWAs under Basel III for the full year
and fourth quarter of 2014.
Table 49: Analysis of Changes in Market Risk Regulatory
Capital and RWAs
(in millions)
Balance, December 31, 2013
Total VaR
Total Stressed VaR
Incremental Risk Charge
Securitized Products Charge
Standardized Specific Risk Charge
De minimis Charges
Balance, December 31, 2014
$
$
Risk-
based
capital
2,907
(106)
548
(48)
133
594
(59)
3,969
Risk-
weighted
assets
36,339
(1,327)
6,847
(596)
1,664
7,420
(734)
49,613
Balance, September 30, 2014
Total VaR
Total Stressed VaR
Incremental Risk Charge
Securitized Products Charge
Standardized Specific Risk Charge
De minimis Charges
Balance, December 31, 2014
$
$
4,089
(97)
110
(23)
18
(120)
(8)
3,969
51,117
(1,215)
1,370
(284)
227
(1,500)
(102)
49,613
The increase in standardized specific risk charge for risk-
based capital and RWAs in 2014 resulted primarily from a
change during the quarter ended March 31, 2014, in positions
now subject to standardized specific risk charges. All changes to
market risk regulatory capital and RWAs in the quarter ended
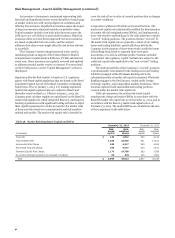
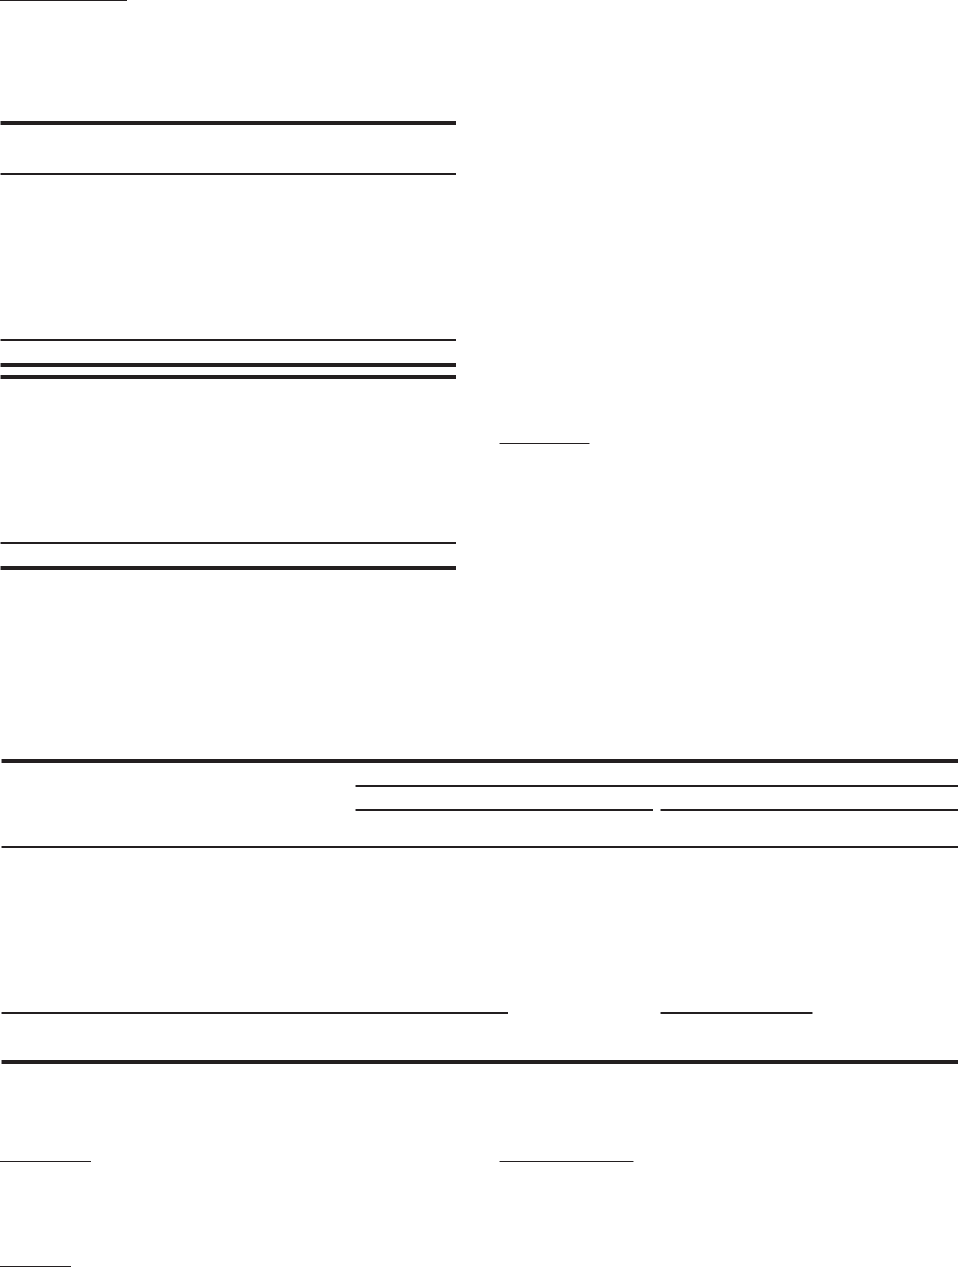
Table 50: Regulatory 10-Day 99% General VaR by Risk Category
December 31, 2014, were associated with changes in positions
due to normal trading activity.
Regulatory Market Risk Capital Components The capital
required for market risk on the Company’s “covered” positions is
determined by internally developed models or standardized
specific risk charges. The market risk regulatory capital models
are subject to internal model risk management and validation.
The models are continuously monitored and enhanced in
response to changes in market conditions, improvements in
system capabilities, and changes in the Company’s market risk
exposure. The Company is required to obtain and has received
prior written approval from its regulators before using its
internally developed models to calculate the market risk capital
charge.
Basel III prescribes various VaR measures in the
determination of regulatory capital and risk-weighted assets.
The Company uses the same VaR models for both market risk
management purposes as well as regulatory capital calculations.
For regulatory purposes, we use the following metrics to
determine the Company’s market risk capital requirements:
General VaR measures the risk of broad market movements such
as changes in the level of credit spreads, interest rates, equity
prices, commodity prices, and foreign exchange rates. General
VaR uses historical simulation analysis based on 99% confidence
level and a 10-day time horizon.
Table 50 shows the General VaR measure categorized by
major risk categories. Average 10-day General VaR was
$36 million for the quarter ended December 31, 2014, compared
with $29 million for the quarter ended September 30, 2014. The
increase was primarily driven by changes in portfolio
composition.
Quarter ended
December 31, 2014 September 30, 2014
Period Period
(in millions) end Average Low High end Average Low High
Wholesale General VaR Risk Categories
Credit $ 34 45 34 52 47 43 25 74
Interest rate 66 68 48 96 73 79 63 103
Equity 9 10 4 16 10 7 4 11
Commodity 3 3 1 7 3 4 2 9
Foreign exchange 4 3 1 11 2 4 1 16
Diversification benefit (1) (81) (92) (102) (107)
Wholesale General VaR $ 35 37 22 54 33 30 20 44
Company General VaR 35 36 23 54 33 29 19 42
(1) The period-end VaR was less than the sum of the VaR components described above, which is due to portfolio diversification. The diversification effect arises because the
risks are not perfectly correlated causing a portfolio of positions to usually be less risky than the sum of the risks of the positions alone. The diversification benefit is not
meaningful for low and high metrics since they may occur on different days.
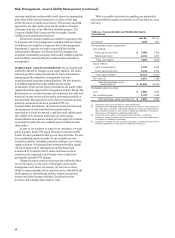
Specific Risk measures the risk of loss that could result from Total Stressed VaR (as presented in Table 51) uses a historical
factors other than broad market movements, or name-specific period of significant financial stress over a continuous 12 month
market risk. Specific Risk uses Monte Carlo simulation analysis period using historically available market data and is composed
based on a 99% confidence level and a 10-day time horizon. of Stressed General VaR and Stressed Specific Risk. Total
Stressed VaR uses the same methodology and models as Total
Total VaR (as presented in Table 51) is composed of General VaR VaR.
and Specific Risk and uses the previous 12 months of historical
market data to comply with regulatory requirements.
93