Wells Fargo 2014 Annual Report Download - page 83
Download and view the complete annual report
Please find page 83 of the 2014 Wells Fargo annual report below. You can navigate through the pages in the report by either clicking on the pages listed below, or by using the keyword search tool below to find specific information within the annual report.-
 1
1 -
2
-
3
-
4
-
5
-
6
-
7
-
8
-
9
-
10
-
11
-
12
-
13
-
14
-
15
-
16
-
17
-
18
-
19
-
20
-
21
-
22
-
23
-
24
-
25
-
26
-
27
-
28
-
29
-
30
-
31
-
32
-
33
-
34
-
35
-
36
-
37
-
38
-
39
-
40
-
41
-
42
-
43
-
44
-
45
-
46
-
47
-
48
-
49
-
50
-
51
-
52
-
53
-
54
-
55
-
56
-
57
-
58
-
59
-
60
-
61
-
62
-
63
-
64
-
65
-
66
-
67
-
68
-
69
-
70
-
71
-
72
-
 73
73 -
 74
74 -
 75
75 -
 76
76 -
 77
77 -
 78
78 -
 79
79 -
 80
80 -
 81
81 -
 82
82 -
 83
83 -
 84
84 -
 85
85 -
 86
86 -
 87
87 -
 88
88 -
 89
89 -
 90
90 -
 91
91 -
 92
92 -
 93
93 -
94
-
95
-
96
-
97
-
98
-
99
-
100
-
101
-
102
-
103
-
104
-
105
-
106
-
107
-
108
-
109
-
110
-
111
-
112
-
113
-
114
-
115
-
116
-
117
-
118
-
119
-
120
-
121
-
122
-
123
-
124
-
125
-
126
-
127
-
128
-
129
-
130
-
131
-
132
-
133
-
134
-
135
-
136
-
137
-
138
-
139
-
140
-
141
-
142
-
143
-
144
-
145
-
146
-
147
-
148
-
149
-
150
-
151
-
152
-
153
-
154
-
155
-
156
-
157
-
158
-
159
-
160
-
161
-
162
-
163
-
164
-
165
-
166
-
167
-
168
-
169
-
170
-
171
-
172
-
173
-
174
-
175
-
176
-
177
-
178
-
179
-
180
-
181
-
182
-
183
-
184
-
185
-
186
-
187
-
188
-
189
-
190
-
191
-
192
-
193
-
194
-
195
-
196
-
197
-
198
-
199
-
200
-
201
-
202
-
203
-
204
-
205
-
206
-
207
-
208
-
209
-
210
-
211
-
212
-
213
-
214
-
215
-
216
-
217
-
218
-
219
-
220
-
221
-
222
-
223
-
224
-
225
-
226
-
227
-
228
-
229
-
230
-
231
-
232
-
233
-
234
-
235
-
236
-
237
-
238
-
239
-
240
-
241
-
242
-
243
-
244
-
245
-
246
-
247
-
248
-
249
-
250
-
251
-
252
-
253
-
254
-
255
-
256
-
257
-
258
-
259
-
260
-
261
-
262
-
263
-
264
-
265
-
266
-
267
-
268
 |
 |

ALLOWANCE FOR CREDIT LOSSES The allowance for credit
losses, which consists of the allowance for loan losses and the
allowance for unfunded credit commitments, is management’s
estimate of credit losses inherent in the loan portfolio and
unfunded credit commitments at the balance sheet date,
excluding loans carried at fair value. The detail of the changes in
the allowance for credit losses by portfolio segment (including
charge-offs and recoveries by loan class) is in Note 6 (Loans and
Allowance for Credit Losses) to Financial Statements in this
Report.
We apply a disciplined process and methodology to
establish our allowance for credit losses each quarter. This
process takes into consideration many factors, including
historical and forecasted loss trends, loan-level credit quality
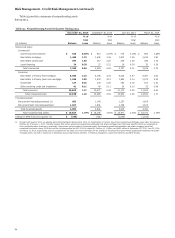
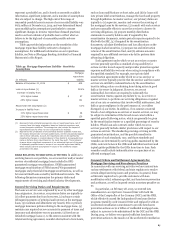
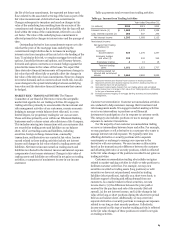
Table 40: Allocation of the Allowance for Credit Losses (ACL)
ratings and loan grade-specific characteristics. The process
involves subjective and complex judgments. In addition, we
review a variety of credit metrics and trends. These credit
metrics and trends, however, do not solely determine the
amount of the allowance as we use several analytical tools. For
additional information on our allowance for credit losses, see the
“Critical Accounting Policies – Allowance for Credit Losses”
section and Note 1 (Summary of Significant Accounting Policies)
and Note 6 (Loans and Allowance for Credit Losses) to Financial
Statements in this Report.
Table 40 presents the allocation of the allowance for credit
losses by loan segment and class for the last five years.
Dec 31, 2014 Dec 31, 2013 Dec 31, 2012 Dec 31, 2011 Dec 31, 2010
Loans Loans Loans Loans Loans
as % as % as % as % as %
of total of total of total of total of total
(in millions) ACL loans ACL loans ACL loans ACL loans ACL loans
Commercial:
Commercial and industrial $ 3,506 32% $ 3,040 29% $ 2,789 28% $ 2,810 27% $ 3,531 24%
Real estate mortgage 1,576 13 2,157 14 2,284 13 2,570 14 3,072 13
Real estate construction 1,097 2 775 2 552 2 893 2 1,387 4
Lease financing 198 1 131 1 89 2 85 2 179 2
Total commercial 6,377 48 6,103 46 5,714 45 6,358 45 8,169 43
Consumer:
Real estate 1-4 family first mortgage 2,878 31 4,087 32 6,100 31 6,934 30 7,603 30
Real estate 1-4 family junior lien
mortgage 1,566 7 2,534 8 3,462 10 3,897 11 4,557 13
Credit card 1,271 4 1,224 3 1,234 3 1,294 3 1,945 3
Automobile 516 6 475 6 417 6 555 6 771 6
Other revolving credit and
installment 561 4 548 5 550 5 630 5 418 5
Total consumer 6,792 52 8,868 54 11,763 55 13,310 55 15,294 57
Total $ 13,169 100% $ 14,971 100% $ 17,477 100% $ 19,668 100% $ 23,463 100%
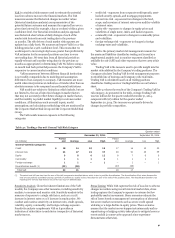
Dec 31, 2014 Dec 31, 2013 Dec 31, 2012 Dec 31, 2011 Dec 31, 2010
Components:
Allowance for loan losses $ 12,319 14,502 17,060 19,372 23,022
Allowance for unfunded credit
commitments 850 469 417 296 441
Allowance for credit losses $ 13,169 14,971 17,477 19,668 23,463
Allowance for loan losses as a
percentage of total loans 1.43% 1.76 2.13 2.52 3.04
Allowance for loan losses as a
percentage of total net charge-offs 418 322 189 171 130
Allowance for credit losses as a
percentage of total loans 1.53 1.82 2.19 2.56 3.10
Allowance for credit losses as a
percentage of total nonaccrual loans 103 96 85 92 89
In addition to the allowance for credit losses, there was
$2.9 billion at December 31, 2014, and $5.2 billion at
December 31, 2013, of nonaccretable difference to absorb losses
for PCI loans. The allowance for credit losses is lower than
otherwise would have been required without PCI loan
accounting. As a result of PCI loans, certain ratios of the
Company may not be directly comparable with credit-related
metrics for other financial institutions. For additional
information on PCI loans, see the “Risk Management – Credit
Risk Management – Purchased Credit-Impaired Loans” section,
Note 1 (Summary of Significant Accounting Policies) and Note 6
(Loans and Allowance for Credit Losses) to Financial Statements
in this Report.
The ratio of the allowance for credit losses to total
nonaccrual loans may fluctuate significantly from period to
period due to such factors as the mix of loan types in the
portfolio, borrower credit strength and the value and
marketability of collateral. Substantially all of our nonaccrual
81