Wells Fargo 2014 Annual Report Download - page 82
Download and view the complete annual report
Please find page 82 of the 2014 Wells Fargo annual report below. You can navigate through the pages in the report by either clicking on the pages listed below, or by using the keyword search tool below to find specific information within the annual report.-
 1
1 -
2
-
3
-
4
-
5
-
6
-
7
-
8
-
9
-
10
-
11
-
12
-
13
-
14
-
15
-
16
-
17
-
18
-
19
-
20
-
21
-
22
-
23
-
24
-
25
-
26
-
27
-
28
-
29
-
30
-
31
-
32
-
33
-
34
-
35
-
36
-
37
-
38
-
39
-
40
-
41
-
42
-
43
-
44
-
45
-
46
-
47
-
48
-
49
-
50
-
51
-
52
-
53
-
54
-
55
-
56
-
57
-
58
-
59
-
60
-
61
-
62
-
63
-
64
-
65
-
66
-
67
-
68
-
69
-
70
-
71
-
 72
72 -
 73
73 -
 74
74 -
 75
75 -
 76
76 -
 77
77 -
 78
78 -
 79
79 -
 80
80 -
 81
81 -
 82
82 -
 83
83 -
 84
84 -
 85
85 -
 86
86 -
 87
87 -
 88
88 -
 89
89 -
 90
90 -
 91
91 -
 92
92 -
93
-
94
-
95
-
96
-
97
-
98
-
99
-
100
-
101
-
102
-
103
-
104
-
105
-
106
-
107
-
108
-
109
-
110
-
111
-
112
-
113
-
114
-
115
-
116
-
117
-
118
-
119
-
120
-
121
-
122
-
123
-
124
-
125
-
126
-
127
-
128
-
129
-
130
-
131
-
132
-
133
-
134
-
135
-
136
-
137
-
138
-
139
-
140
-
141
-
142
-
143
-
144
-
145
-
146
-
147
-
148
-
149
-
150
-
151
-
152
-
153
-
154
-
155
-
156
-
157
-
158
-
159
-
160
-
161
-
162
-
163
-
164
-
165
-
166
-
167
-
168
-
169
-
170
-
171
-
172
-
173
-
174
-
175
-
176
-
177
-
178
-
179
-
180
-
181
-
182
-
183
-
184
-
185
-
186
-
187
-
188
-
189
-
190
-
191
-
192
-
193
-
194
-
195
-
196
-
197
-
198
-
199
-
200
-
201
-
202
-
203
-
204
-
205
-
206
-
207
-
208
-
209
-
210
-
211
-
212
-
213
-
214
-
215
-
216
-
217
-
218
-
219
-
220
-
221
-
222
-
223
-
224
-
225
-
226
-
227
-
228
-
229
-
230
-
231
-
232
-
233
-
234
-
235
-
236
-
237
-
238
-
239
-
240
-
241
-
242
-
243
-
244
-
245
-
246
-
247
-
248
-
249
-
250
-
251
-
252
-
253
-
254
-
255
-
256
-
257
-
258
-
259
-
260
-
261
-
262
-
263
-
264
-
265
-
266
-
267
-
268
 |
 |
Risk Management - Credit Risk Management (continued)
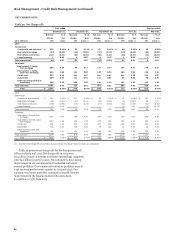
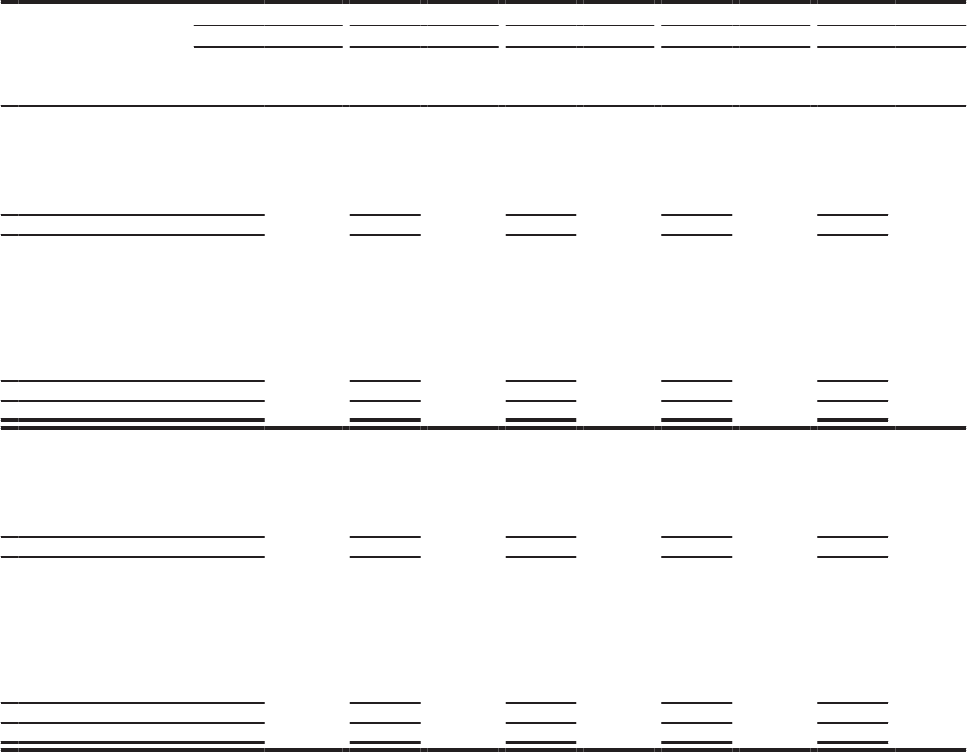
NET CHARGE-OFFS
Table 39: Net Charge-offs
Year ended Quarter ended
December 31, December 31, September 30, June 30, March 31,
Net loan % of Net loan % of Net loan % of Net loan % of Net loan % of
charge- avg. charge- avg. charge- avg. charge- avg. charge- avg.
($ in millions) offs loans offs loans (1) offs loans (1) offs loans (1) offs loans (1)
2014
Commercial:
Commercial and industrial $ 258 0.10% $ 82 0.12% $ 67 0.11% $ 60 0.10% $ 49 0.08%
Real estate mortgage (94) (0.08) (25) (0.09) (37) (0.13) (10) (0.04) (22) (0.08)
Real estate construction (127) (0.72) (26) (0.56) (58) (1.27) (20) (0.47) (23) (0.54)
Lease financing 7 0.06 1 0.05 4 0.10 1 0.05 1 0.03
Total commercial 44 0.01 32 0.03 (24) (0.02) 31 0.03 5 0.01
Consumer:
Real estate 1-4 family
first mortgage 509 0.19 88 0.13 114 0.17 137 0.21 170 0.27
Real estate 1-4 family
junior lien mortgage 626 1.00 134 0.88 140 0.90 160 1.02 192 1.19
Credit card 864 3.14 221 2.97 201 2.87 211 3.20 231 3.57
Automobile 380 0.70 132 0.94 112 0.81 46 0.35 90 0.70
Other revolving credit and
installment 522 1.35 128 1.45 125 1.46 132 1.22 137 1.29
Total consumer 2,901 0.65 703 0.63 692 0.62 686 0.62 820 0.75
Total $ 2,945 0.35% $ 735 0.34% $ 668 0.32% $ 717 0.35% $ 825 0.41%
2013
Commercial:
Commercial and industrial $ 343 0.15 % $ 107 0.18 % $ 55 0.10 % $ 81 0.14 % $ 100 0.18 %
Real estate mortgage (36) (0.03) (41) (0.14) (19) (0.08) (5) (0.02) 29 0.11
Real estate construction (109) (0.66) (13) (0.32) (17) (0.40) (45) (1.09) (34) (0.83)
Lease financing 17 0.14 — — — — 18 0.55 (1) (0.03)
Total commercial 215 0.06 53 0.06 19 0.02 49 0.05 94 0.11
Consumer:
Real estate 1-4 family first
mortgage 1,193 0.47 195 0.30 242 0.38 327 0.52 429 0.69
Real estate 1-4 family junior
lien mortgage 1,310 1.86 226 1.34 275 1.58 360 2.02 449 2.46
Credit card 895 3.62 220 3.38 207 3.28 233 3.90 235 3.95
Automobile 303 0.63 108 0.85 78 0.63 41 0.35 76 0.66
Other revolving credit and
installment 593 1.41 161 1.50 154 1.45 142 1.34 136 1.34
Total consumer 4,294 0.98 910 0.82 956 0.86 1,103 1.01 1,325 1.23
Total $ 4,509 0.56 % $ 963 0.47 % $ 975 0.48 % $ 1,152 0.58 % $ 1,419 0.72 %
(1) Quarterly net charge-offs (recoveries) as a percentage of average respective loans are annualized.
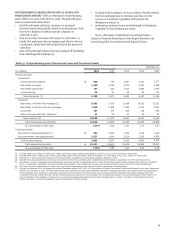
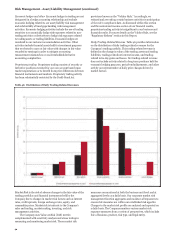
Table 39 presents net charge-offs for the four quarters and
full year of 2014 and 2013. Net charge-offs in 2014 were
$2.9 billion (0.35% of average total loans outstanding) compared
with $4.5 billion (0.56%) in 2013. We continued to have strong
improvement in our commercial and residential real estate
secured portfolios. Our commercial real estate portfolios were in
a net recovery position every quarter in 2014 and 2013. Our
consumer real estate portfolios continued to benefit from the
improvement in the housing market with losses down
$1.4 billion, or 55%, from 2013.
80