Wells Fargo 2014 Annual Report Download - page 219
Download and view the complete annual report
Please find page 219 of the 2014 Wells Fargo annual report below. You can navigate through the pages in the report by either clicking on the pages listed below, or by using the keyword search tool below to find specific information within the annual report.-
 1
1 -
2
-
3
-
4
-
5
-
6
-
7
-
8
-
9
-
10
-
11
-
12
-
13
-
14
-
15
-
16
-
17
-
18
-
19
-
20
-
21
-
22
-
23
-
24
-
25
-
26
-
27
-
28
-
29
-
30
-
31
-
32
-
33
-
34
-
35
-
36
-
37
-
38
-
39
-
40
-
41
-
42
-
43
-
44
-
45
-
46
-
47
-
48
-
49
-
50
-
51
-
52
-
53
-
54
-
55
-
56
-
57
-
58
-
59
-
60
-
61
-
62
-
63
-
64
-
65
-
66
-
67
-
68
-
69
-
70
-
71
-
72
-
73
-
74
-
75
-
76
-
77
-
78
-
79
-
80
-
81
-
82
-
83
-
84
-
85
-
86
-
87
-
88
-
89
-
90
-
91
-
92
-
93
-
94
-
95
-
96
-
97
-
98
-
99
-
100
-
101
-
102
-
103
-
104
-
105
-
106
-
107
-
108
-
109
-
110
-
111
-
112
-
113
-
114
-
115
-
116
-
117
-
118
-
119
-
120
-
121
-
122
-
123
-
124
-
125
-
126
-
127
-
128
-
129
-
130
-
131
-
132
-
133
-
134
-
135
-
136
-
137
-
138
-
139
-
140
-
141
-
142
-
143
-
144
-
145
-
146
-
147
-
148
-
149
-
150
-
151
-
152
-
153
-
154
-
155
-
156
-
157
-
158
-
159
-
160
-
161
-
162
-
163
-
164
-
165
-
166
-
167
-
168
-
169
-
170
-
171
-
172
-
173
-
174
-
175
-
176
-
177
-
178
-
179
-
180
-
181
-
182
-
183
-
184
-
185
-
186
-
187
-
188
-
189
-
190
-
191
-
192
-
193
-
194
-
195
-
196
-
197
-
198
-
199
-
200
-
201
-
202
-
203
-
204
-
205
-
206
-
207
-
208
-
 209
209 -
 210
210 -
 211
211 -
 212
212 -
 213
213 -
 214
214 -
 215
215 -
 216
216 -
 217
217 -
 218
218 -
 219
219 -
 220
220 -
 221
221 -
 222
222 -
 223
223 -
 224
224 -
 225
225 -
 226
226 -
 227
227 -
 228
228 -
 229
229 -
230
-
231
-
232
-
233
-
234
-
235
-
236
-
237
-
238
-
239
-
240
-
241
-
242
-
243
-
244
-
245
-
246
-
247
-
248
-
249
-
250
-
251
-
252
-
253
-
254
-
255
-
256
-
257
-
258
-
259
-
260
-
261
-
262
-
263
-
264
-
265
-
266
-
267
-
268
 |
 |

(continued from previous page)
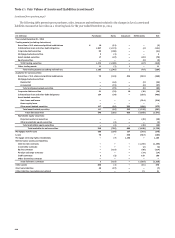
(in millions) Level 1 Level 2 Level 3 Netting Total
December 31, 2013
Trading assets (excluding derivatives)
Securities of U.S. Treasury and federal agencies 8,301 3,669 — — 11,970
Securities of U.S. states and political subdivisions — 2,043 39 — 2,082
Collateralized loan and other debt obligations (1) — 212 541 — 753
Corporate debt securities — 7,052 53 — 7,105
Mortgage-backed securities — 14,608 1 — 14,609
Asset-backed securities — 487 122 — 609
Equity securities 5,908 87 13 — 6,008
Total trading securities (2) 14,209 28,158 769 — 43,136
Other trading assets 2,694 2,487 54 — 5,235
Total trading assets (excluding derivatives) 16,903 30,645 823 — 48,371
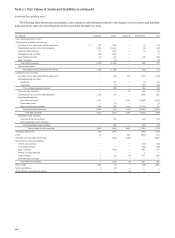
Securities of U.S. Treasury and federal agencies 557 5,723 — — 6,280
Securities of U.S. states and political subdivisions — 39,322 3,214 (3) — 42,536
Mortgage-backed securities:
Federal agencies — 117,591 — — 117,591
Residential — 12,389 64 — 12,453
Commercial — 18,609 138 — 18,747
Total mortgage-backed securities — 148,589 202 — 148,791
Corporate debt securities 113 20,833 281 — 21,227
Collateralized loan and other debt obligations (4) — 18,739 1,420 (3) — 20,159
Asset-backed securities:
Auto loans and leases — 21 492 (3) — 513
Home equity loans — 843 — — 843
Other asset-backed securities — 6,577 1,657 (3) — 8,234
Total asset-backed securities — 7,441 2,149 — 9,590
Other debt securities — 39 — — 39
Total debt securities 670 240,686 7,266 — 248,622
Marketable equity securities:
Perpetual preferred securities (5) 508 628 729 (3) — 1,865
Other marketable equity securities 1,511 9 — — 1,520
Total marketable equity securities 2,019 637 729 — 3,385
Total available-for-sale securities 2,689 241,323 7,995 — 252,007
Mortgages held for sale — 11,505 2,374 — 13,879
Loans held for sale — 1 — — 1
Loans — 272 5,723 — 5,995
Mortgage servicing rights (residential) — — 15,580 — 15,580
Derivative assets:
Interest rate contracts 36 55,466 344 — 55,846
Commodity contracts — 2,667 6 — 2,673
Equity contracts 1,522 4,221 2,081 — 7,824
Foreign exchange contracts 44 4,789 10 — 4,843
Credit contracts — 782 719 — 1,501
Other derivative contracts — — 13 — 13
Netting — — — (56,894) (6) (56,894)
Total derivative assets (7) 1,602 67,925 3,173 (56,894) 15,806
Other assets — — 1,503 — 1,503
Total assets recorded at fair value 21,194 351,671 37,171 (56,894) 353,142
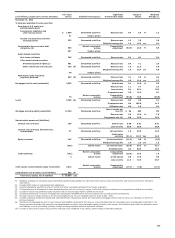
Derivative liabilities:
Interest rate contracts (26) (56,128) (384) — (56,538)
Commodity contracts — (2,587) (16) — (2,603)
Equity contracts (449) (5,218) (2,127) — (7,794)
Foreign exchange contracts (75) (4,432) (1) — (4,508)
Credit contracts — (806) (1,094) — (1,900)
Other derivative contracts — — (16) — (16)
Netting — — — 63,739 (6) 63,739
Total derivative liabilities (7) (550) (69,171) (3,638) 63,739 (9,620)
Short sale liabilities:
Securities of U.S. Treasury and federal agencies (4,311) (2,063) — — (6,374)
Securities of U.S. states and political subdivisions — (24) — — (24)
Corporate debt securities — (4,683) — — (4,683)
Equity securities (1,788) (48) — — (1,836)
Other securities — (95) — — (95)
Total short sale liabilities (6,099) (6,913) — — (13,012)
Other liabilities (excluding derivatives) — — (39) — (39)
Total liabilities recorded at fair value (6,649) (76,084) (3,677) 63,739 (22,671)
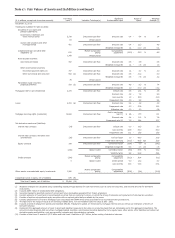
(1) Includes collateralized debt obligations of $2 million.
(2) Net gains from trading activities recognized in the income statement for the year ended December 31, 2013 include $(29) million in net unrealized losses on trading
securities held at December 31, 2013.
(3) Balances consist of securities that are predominantly investment grade based on ratings received from the ratings agencies or internal credit grades categorized as
investment grade if external ratings are not available. The securities are classified as Level 3 due to limited market activity.
(4) Includes collateralized debt obligations of $693 million.
(5) Perpetual preferred securities include ARS and corporate preferred securities. See Note 8 (Securitizations and Variable Interest Entities) for additional information.
(6) Represents balance sheet netting of derivative asset and liability balances and related cash collateral. See Note 16 (Derivatives) for additional information.
(7) Derivative assets and derivative liabilities include contracts qualifying for hedge accounting, economic hedges, and derivatives included in trading assets and trading
liabilities, respectively.
217