Wells Fargo 2014 Annual Report Download - page 201
Download and view the complete annual report
Please find page 201 of the 2014 Wells Fargo annual report below. You can navigate through the pages in the report by either clicking on the pages listed below, or by using the keyword search tool below to find specific information within the annual report.-
 1
1 -
2
-
3
-
4
-
5
-
6
-
7
-
8
-
9
-
10
-
11
-
12
-
13
-
14
-
15
-
16
-
17
-
18
-
19
-
20
-
21
-
22
-
23
-
24
-
25
-
26
-
27
-
28
-
29
-
30
-
31
-
32
-
33
-
34
-
35
-
36
-
37
-
38
-
39
-
40
-
41
-
42
-
43
-
44
-
45
-
46
-
47
-
48
-
49
-
50
-
51
-
52
-
53
-
54
-
55
-
56
-
57
-
58
-
59
-
60
-
61
-
62
-
63
-
64
-
65
-
66
-
67
-
68
-
69
-
70
-
71
-
72
-
73
-
74
-
75
-
76
-
77
-
78
-
79
-
80
-
81
-
82
-
83
-
84
-
85
-
86
-
87
-
88
-
89
-
90
-
91
-
92
-
93
-
94
-
95
-
96
-
97
-
98
-
99
-
100
-
101
-
102
-
103
-
104
-
105
-
106
-
107
-
108
-
109
-
110
-
111
-
112
-
113
-
114
-
115
-
116
-
117
-
118
-
119
-
120
-
121
-
122
-
123
-
124
-
125
-
126
-
127
-
128
-
129
-
130
-
131
-
132
-
133
-
134
-
135
-
136
-
137
-
138
-
139
-
140
-
141
-
142
-
143
-
144
-
145
-
146
-
147
-
148
-
149
-
150
-
151
-
152
-
153
-
154
-
155
-
156
-
157
-
158
-
159
-
160
-
161
-
162
-
163
-
164
-
165
-
166
-
167
-
168
-
169
-
170
-
171
-
172
-
173
-
174
-
175
-
176
-
177
-
178
-
179
-
180
-
181
-
182
-
183
-
184
-
185
-
186
-
187
-
188
-
189
-
190
-
 191
191 -
 192
192 -
 193
193 -
 194
194 -
 195
195 -
 196
196 -
 197
197 -
 198
198 -
 199
199 -
 200
200 -
 201
201 -
 202
202 -
 203
203 -
 204
204 -
 205
205 -
 206
206 -
 207
207 -
 208
208 -
 209
209 -
 210
210 -
 211
211 -
212
-
213
-
214
-
215
-
216
-
217
-
218
-
219
-
220
-
221
-
222
-
223
-
224
-
225
-
226
-
227
-
228
-
229
-
230
-
231
-
232
-
233
-
234
-
235
-
236
-
237
-
238
-
239
-
240
-
241
-
242
-
243
-
244
-
245
-
246
-
247
-
248
-
249
-
250
-
251
-
252
-
253
-
254
-
255
-
256
-
257
-
258
-
259
-
260
-
261
-
262
-
263
-
264
-
265
-
266
-
267
-
268
 |
 |

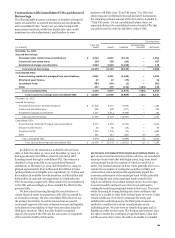
Note 14: Guarantees, Pledged Assets and Collateral
Guarantees are contracts that contingently require us to make recourse obligations, and other types of arrangements. The
payments to a guaranteed party based on an event or a change in following table shows carrying value, maximum exposure to loss
an underlying asset, liability, rate or index. Guarantees are on our guarantees and the related non-investment grade
generally in the form of standby letters of credit, securities amounts.
lending and other indemnifications, written put options,
December 31, 2014
Maximum exposure to loss
Expires
after one Expires
year after three
Expires in through years Expires Non-
Carrying one year three through after five investment
(in millions) value or less years five years years Total grade
Standby letters of credit (1) $ 41 16,271 10,269 6,295 645 33,480 8,447
Securities lending and other
indemnifications — — 2 2 5,948 5,952 —
Written put options (2) 469 7,644 5,256 2,822 2,409 18,131 7,902
Loans and MHFS sold with recourse 72 131 486 822 5,386 6,825 3,945
Factoring guarantees — 3,460 — — — 3,460 3,460
Other guarantees 24 9 85 22 2,158 2,274 69
Total guarantees $ 606 27,515 16,098 9,963 16,546 70,122 23,823
December 31, 2013
Maximum exposure to loss
Expires Expires
after one after three
Expires in year years Expires Non-
Carrying one year or through through five after five investment
(in millions) value less three years years years Total grade
Standby letters of credit (1) $ 56 16,907 11,628 5,308 994 34,837 9,512
Securities lending and other
indemnifications — — 3 18 3,199 3,220 25
Written put options (2) 907 4,775 2,967 3,521 2,725 13,988 4,311
Loans and MHFS sold with recourse 86 116 418 849 5,014 6,397 3,674
Factoring guarantees — 2,915 — — — 2,915 2,915
Other guarantees (3) 33 34 111 16 971 1,132 113
Total guarantees $ 1,082 24,747 15,127 9,712 12,903 62,489 20,550
(1) Total maximum exposure to loss includes direct pay letters of credit (DPLCs) of $15.0 billion and $16.8 billion at December 31, 2014 and 2013, respectively. We issue
DPLCs to provide credit enhancements for certain bond issuances. Beneficiaries (bond trustees) may draw upon these instruments to make scheduled principal and interest
payments, redeem all outstanding bonds because a default event has occurred, or for other reasons as permitted by the agreement. We also originate multipurpose lending
commitments under which borrowers have the option to draw on the facility in one of several forms, including as a standby letter of credit. Total maximum exposure to loss
includes the portion of these facilities for which we have issued standby letters of credit under the commitments.
(2) Written put options, which are in the form of derivatives, are also included in the derivative disclosure in Note 16 (Derivatives).
(3) Includes amounts for liquidity agreements and contingent consideration that were previously reported separately.
“Maximum exposure to loss” and “Non-investment grade”
are required disclosures under GAAP. Non-investment grade
represents those guarantees on which we have a higher risk of
being required to perform under the terms of the guarantee. If
the underlying assets under the guarantee are non-investment
grade (that is, an external rating that is below investment grade
or an internal credit default grade that is equivalent to a below
investment grade external rating), we consider the risk of
performance to be high. Internal credit default grades are
determined based upon the same credit policies that we use to
evaluate the risk of payment or performance when making loans
and other extensions of credit. These credit policies are further
described in Note 6 (Loans and Allowance for Credit Losses).
Maximum exposure to loss represents the estimated loss
that would be incurred under an assumed hypothetical
circumstance, despite what we believe is its extremely remote
possibility, where the value of our interests and any associated
collateral declines to zero. Maximum exposure to loss estimates
in the table above do not reflect economic hedges or collateral we
could use to offset or recover losses we may incur under our
guarantee agreements. Accordingly, this required disclosure is
not an indication of expected loss. We believe the carrying value,
which is either fair value for derivative-related products or the
allowance for lending-related commitments, is more
representative of our exposure to loss than maximum exposure
to loss.
STANDBY LETTERS OF CREDIT We issue standby letters of
credit, which include performance and financial guarantees, for
customers in connection with contracts between our customers
and third parties. Standby letters of credit are agreements where
we are obligated to make payment to a third party on behalf of a
customer if the customer fails to meet their contractual
obligations. We consider the credit risk in standby letters of
credit and commercial and similar letters of credit in
determining the allowance for credit losses.
199