Wells Fargo 2014 Annual Report Download - page 65
Download and view the complete annual report
Please find page 65 of the 2014 Wells Fargo annual report below. You can navigate through the pages in the report by either clicking on the pages listed below, or by using the keyword search tool below to find specific information within the annual report.-
 1
1 -
2
-
3
-
4
-
5
-
6
-
7
-
8
-
9
-
10
-
11
-
12
-
13
-
14
-
15
-
16
-
17
-
18
-
19
-
20
-
21
-
22
-
23
-
24
-
25
-
26
-
27
-
28
-
29
-
30
-
31
-
32
-
33
-
34
-
35
-
36
-
37
-
38
-
39
-
40
-
41
-
42
-
43
-
44
-
45
-
46
-
47
-
48
-
49
-
50
-
51
-
52
-
53
-
54
-
 55
55 -
 56
56 -
 57
57 -
 58
58 -
 59
59 -
 60
60 -
 61
61 -
 62
62 -
 63
63 -
 64
64 -
 65
65 -
 66
66 -
 67
67 -
 68
68 -
 69
69 -
 70
70 -
 71
71 -
 72
72 -
 73
73 -
 74
74 -
 75
75 -
76
-
77
-
78
-
79
-
80
-
81
-
82
-
83
-
84
-
85
-
86
-
87
-
88
-
89
-
90
-
91
-
92
-
93
-
94
-
95
-
96
-
97
-
98
-
99
-
100
-
101
-
102
-
103
-
104
-
105
-
106
-
107
-
108
-
109
-
110
-
111
-
112
-
113
-
114
-
115
-
116
-
117
-
118
-
119
-
120
-
121
-
122
-
123
-
124
-
125
-
126
-
127
-
128
-
129
-
130
-
131
-
132
-
133
-
134
-
135
-
136
-
137
-
138
-
139
-
140
-
141
-
142
-
143
-
144
-
145
-
146
-
147
-
148
-
149
-
150
-
151
-
152
-
153
-
154
-
155
-
156
-
157
-
158
-
159
-
160
-
161
-
162
-
163
-
164
-
165
-
166
-
167
-
168
-
169
-
170
-
171
-
172
-
173
-
174
-
175
-
176
-
177
-
178
-
179
-
180
-
181
-
182
-
183
-
184
-
185
-
186
-
187
-
188
-
189
-
190
-
191
-
192
-
193
-
194
-
195
-
196
-
197
-
198
-
199
-
200
-
201
-
202
-
203
-
204
-
205
-
206
-
207
-
208
-
209
-
210
-
211
-
212
-
213
-
214
-
215
-
216
-
217
-
218
-
219
-
220
-
221
-
222
-
223
-
224
-
225
-
226
-
227
-
228
-
229
-
230
-
231
-
232
-
233
-
234
-
235
-
236
-
237
-
238
-
239
-
240
-
241
-
242
-
243
-
244
-
245
-
246
-
247
-
248
-
249
-
250
-
251
-
252
-
253
-
254
-
255
-
256
-
257
-
258
-
259
-
260
-
261
-
262
-
263
-
264
-
265
-
266
-
267
-
268
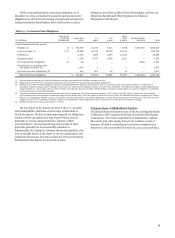
 |
 |

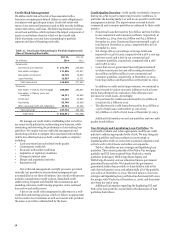
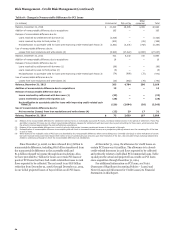
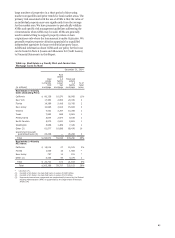
COMMERCIAL REAL ESTATE (CRE) We generally subject CRE
loans to individual risk assessment using our internal borrower
and collateral quality ratings. Our ratings are aligned to
regulatory definitions of pass and criticized categories with
criticized divided between special mention, substandard,
doubtful and loss categories. The CRE portfolio, which included
$5.0 billion of foreign CRE loans, totaled $130.7 billion, or 15%,
of total loans at December 31, 2014, and consisted of
$112.0 billion of mortgage loans and $18.7 billion of
construction loans. Foreign loans were not reported in this
category in prior periods, but in a separate foreign loan class.
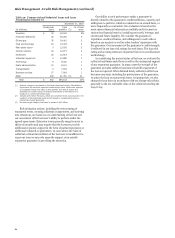
Table 21 summarizes CRE loans by state and property type with
the related nonaccrual totals. The portfolio is diversified both
geographically and by property type. The largest geographic
concentrations of combined CRE loans are in California (28% of
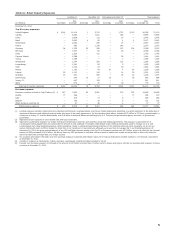
Table 21: CRE Loans by State and Property Type
the total CRE portfolio), and in Texas and Florida (8% in each
state). By property type, the largest concentrations are office
buildings at 27% and apartments at 14% of the portfolio. CRE
nonaccrual loans totaled 1.3% of the CRE outstanding balance at
December 31, 2014, compared with 2.1% at December 31, 2013.
At December 31, 2014, we had $7.9 billion of criticized CRE
mortgage loans, down from $13.1 billion at December 31, 2013,
and $949 million of criticized CRE construction loans, down
from $2.1 billion at December 31, 2013.
At December 31, 2014, the recorded investment in PCI CRE
loans totaled $1.4 billion, down from $12.3 billion when
acquired at December 31, 2008, reflecting principal payments,
loan resolutions and write-downs.
December 31, 2014
Real estate mortgage Real estate construction Total % of
Nonaccrual Total Nonaccrual Total Nonaccrual Total total
(in millions) loans portfolio (1) loans portfolio (1) loans portfolio (1) loans
By state:
California $ 371 32,993 28 3,589 399 36,582 4%
Texas 96 8,641 — 1,735 96 10,376 1
Florida 182 7,942 8 1,892 190 9,834 1
New York 40 6,851 4 1,233 44 8,084 1
North Carolina 85 3,847 8 1,048 93 4,895 1
Arizona 77 3,646 1 402 78 4,048 *
Washington 32 3,227 1 603 33 3,830 *
Virginia 40 2,444 4 1,039 44 3,483 *
Georgia 104 3,048 28 427 132 3,475 *
Colorado 27 2,775 1 440 28 3,215 *
Other 436 36,582 104 6,320 540 42,902 (2) 5
Total $ 1,490 111,996 187 18,728 1,677 130,724 15%
By property:
Office buildings $ 405 33,438 1 2,338 406 35,776 4%
Apartments 43 11,910 4 6,315 47 18,225 2
Industrial/warehouse 234 12,225 — 1,082 234 13,307 2
Retail (excluding shopping center) 183 12,100 2 866 185 12,966 2
Real estate - other 188 10,929 — 388 188 11,317 1
Hotel/motel 74 8,770 — 986 74 9,756 1
Shopping center 79 8,541 — 1,185 79 9,726 1
Institutional 70 3,168 — 432 70 3,600 *
Agriculture 33 2,370 — 24 33 2,394 *
Land (excluding 1-4 family) 3 114 32 2,253 35 2,367 *
Other 178 8,431 148 2,859 326 11,290 1
Total $ 1,490 111,996 187 18,728 1,677 130,724 15%
* Less than 1%.
(1) Includes a total of $1.4 billion PCI loans, consisting of $1.3 billion of real estate mortgage and $171 million of real estate construction, which are considered to be accruing
due to the existence of the accretable yield and not based on consideration given to contractual interest payments.
(2) Includes 40 states; no state had loans in excess of $3.0 billion.
63