Wells Fargo 2014 Annual Report Download - page 265
Download and view the complete annual report
Please find page 265 of the 2014 Wells Fargo annual report below. You can navigate through the pages in the report by either clicking on the pages listed below, or by using the keyword search tool below to find specific information within the annual report.-
 1
1 -
2
-
3
-
4
-
5
-
6
-
7
-
8
-
9
-
10
-
11
-
12
-
13
-
14
-
15
-
16
-
17
-
18
-
19
-
20
-
21
-
22
-
23
-
24
-
25
-
26
-
27
-
28
-
29
-
30
-
31
-
32
-
33
-
34
-
35
-
36
-
37
-
38
-
39
-
40
-
41
-
42
-
43
-
44
-
45
-
46
-
47
-
48
-
49
-
50
-
51
-
52
-
53
-
54
-
55
-
56
-
57
-
58
-
59
-
60
-
61
-
62
-
63
-
64
-
65
-
66
-
67
-
68
-
69
-
70
-
71
-
72
-
73
-
74
-
75
-
76
-
77
-
78
-
79
-
80
-
81
-
82
-
83
-
84
-
85
-
86
-
87
-
88
-
89
-
90
-
91
-
92
-
93
-
94
-
95
-
96
-
97
-
98
-
99
-
100
-
101
-
102
-
103
-
104
-
105
-
106
-
107
-
108
-
109
-
110
-
111
-
112
-
113
-
114
-
115
-
116
-
117
-
118
-
119
-
120
-
121
-
122
-
123
-
124
-
125
-
126
-
127
-
128
-
129
-
130
-
131
-
132
-
133
-
134
-
135
-
136
-
137
-
138
-
139
-
140
-
141
-
142
-
143
-
144
-
145
-
146
-
147
-
148
-
149
-
150
-
151
-
152
-
153
-
154
-
155
-
156
-
157
-
158
-
159
-
160
-
161
-
162
-
163
-
164
-
165
-
166
-
167
-
168
-
169
-
170
-
171
-
172
-
173
-
174
-
175
-
176
-
177
-
178
-
179
-
180
-
181
-
182
-
183
-
184
-
185
-
186
-
187
-
188
-
189
-
190
-
191
-
192
-
193
-
194
-
195
-
196
-
197
-
198
-
199
-
200
-
201
-
202
-
203
-
204
-
205
-
206
-
207
-
208
-
209
-
210
-
211
-
212
-
213
-
214
-
215
-
216
-
217
-
218
-
219
-
220
-
221
-
222
-
223
-
224
-
225
-
226
-
227
-
228
-
229
-
230
-
231
-
232
-
233
-
234
-
235
-
236
-
237
-
238
-
239
-
240
-
241
-
242
-
243
-
244
-
245
-
246
-
247
-
248
-
249
-
250
-
251
-
252
-
253
-
254
-
 255
255 -
 256
256 -
 257
257 -
 258
258 -
 259
259 -
 260
260 -
 261
261 -
 262
262 -
 263
263 -
 264
264 -
 265
265 -
 266
266 -
 267
267 -
 268
268
 |
 |
263
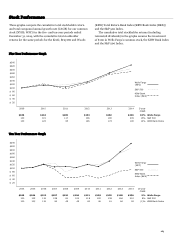
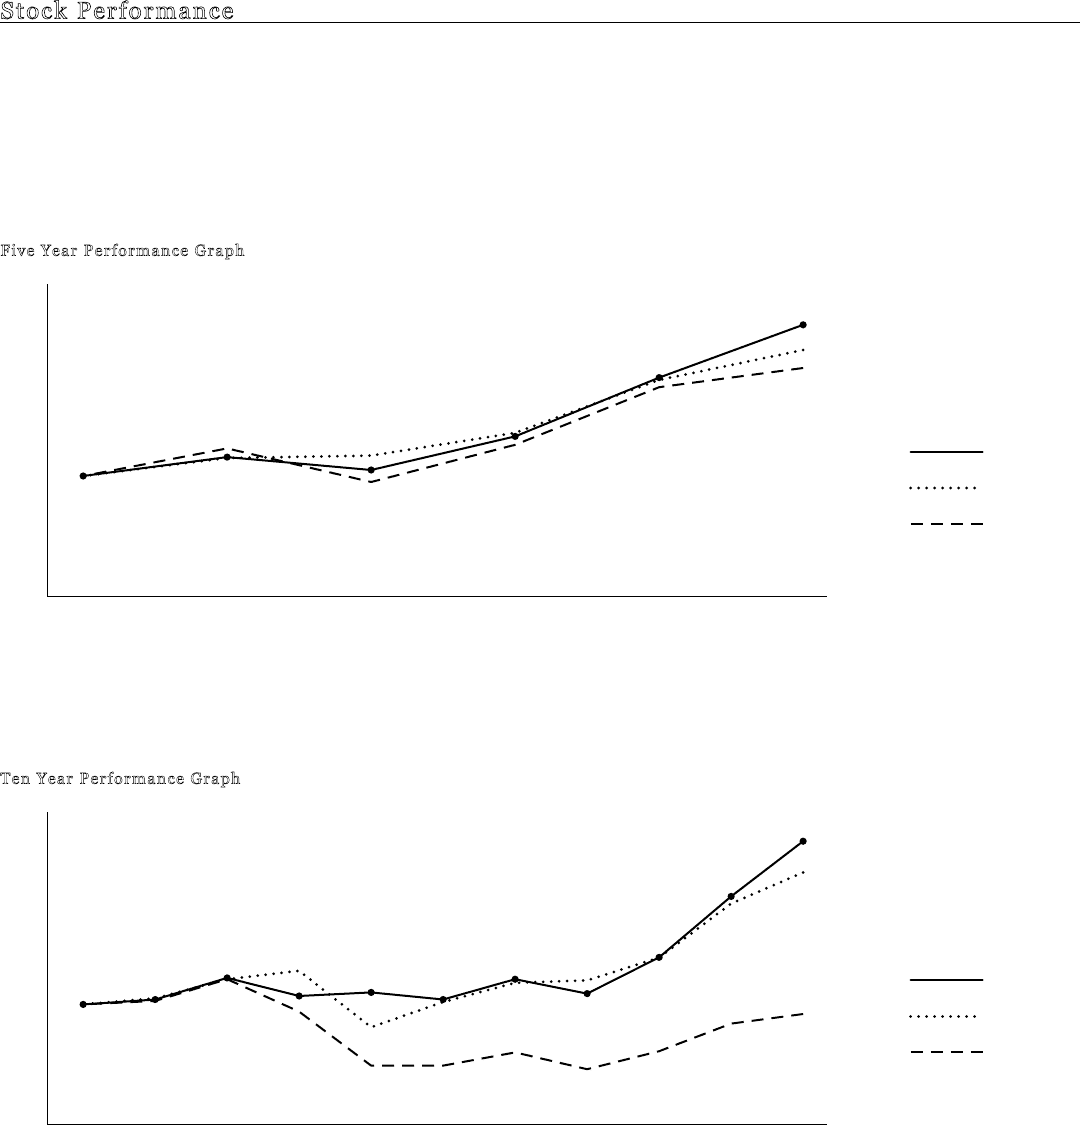
Stock Performance
These graphs compare the cumulative total stockholder return
and total compound annual growth rate (CAGR) for our common
stock (NYSE: WFC) for the five-and ten-year periods ended
December 31, 2014, with the cumulative total stockholder
returns for the same periods for the Keefe, Bruyette and Woods
Five Year Performance Graph
(KBW) Total Return Bank Index (KBW Bank Index (BKX))
and the S&P 500 Index.
The cumulative total stockholder returns (including
reinvested dividends) in the graphs assume the investment
of $100 in Wells Fargo’s common stock, the KBW Bank Index
and the S&P 500 Index.
$240
$220
$200
$180
$160
$140
$120
$100
$ 80
$ 60
$ 40
$ 20
Wells Fargo
(WFC)
S&P 500
KBW Bank
Index (BKX)
2009
$100
100
100
2010
$116
115
123
2011
$105
117
95
2012
$133
136
126
2013
$182
180
174
2014
$226
205
190
5-year
CAGR
18%
15%
14%
Wells Fargo
S&P 500
KBW Bank Index
Ten Year Performance Graph
$240
$220
$200
$180
$160
$140
$120
$100
$ 80
$ 60
$ 40
$ 20
Wells Fargo
(WFC)
S&P 500
KBW Bank
Index (BKX)
2004 2005 2006 2007 2008 2009 2010 2011 2012 2013 2014 10-year
CAGR
$100 $104 $122 $107 $110 $104 $121 $109 $139 $190 $236 9% Wells Fargo
100 105 121 128 81 102 118 120 139 184 210 8% S&P 500
100 103 121 94 49 49 60 46 61 84 92 (1)% KBW Bank Index
263