Wells Fargo 2014 Annual Report Download - page 106
Download and view the complete annual report
Please find page 106 of the 2014 Wells Fargo annual report below. You can navigate through the pages in the report by either clicking on the pages listed below, or by using the keyword search tool below to find specific information within the annual report.-
 1
1 -
2
-
3
-
4
-
5
-
6
-
7
-
8
-
9
-
10
-
11
-
12
-
13
-
14
-
15
-
16
-
17
-
18
-
19
-
20
-
21
-
22
-
23
-
24
-
25
-
26
-
27
-
28
-
29
-
30
-
31
-
32
-
33
-
34
-
35
-
36
-
37
-
38
-
39
-
40
-
41
-
42
-
43
-
44
-
45
-
46
-
47
-
48
-
49
-
50
-
51
-
52
-
53
-
54
-
55
-
56
-
57
-
58
-
59
-
60
-
61
-
62
-
63
-
64
-
65
-
66
-
67
-
68
-
69
-
70
-
71
-
72
-
73
-
74
-
75
-
76
-
77
-
78
-
79
-
80
-
81
-
82
-
83
-
84
-
85
-
86
-
87
-
88
-
89
-
90
-
91
-
92
-
93
-
94
-
95
-
 96
96 -
 97
97 -
 98
98 -
 99
99 -
 100
100 -
 101
101 -
 102
102 -
 103
103 -
 104
104 -
 105
105 -
 106
106 -
 107
107 -
 108
108 -
 109
109 -
 110
110 -
 111
111 -
 112
112 -
 113
113 -
 114
114 -
 115
115 -
 116
116 -
117
-
118
-
119
-
120
-
121
-
122
-
123
-
124
-
125
-
126
-
127
-
128
-
129
-
130
-
131
-
132
-
133
-
134
-
135
-
136
-
137
-
138
-
139
-
140
-
141
-
142
-
143
-
144
-
145
-
146
-
147
-
148
-
149
-
150
-
151
-
152
-
153
-
154
-
155
-
156
-
157
-
158
-
159
-
160
-
161
-
162
-
163
-
164
-
165
-
166
-
167
-
168
-
169
-
170
-
171
-
172
-
173
-
174
-
175
-
176
-
177
-
178
-
179
-
180
-
181
-
182
-
183
-
184
-
185
-
186
-
187
-
188
-
189
-
190
-
191
-
192
-
193
-
194
-
195
-
196
-
197
-
198
-
199
-
200
-
201
-
202
-
203
-
204
-
205
-
206
-
207
-
208
-
209
-
210
-
211
-
212
-
213
-
214
-
215
-
216
-
217
-
218
-
219
-
220
-
221
-
222
-
223
-
224
-
225
-
226
-
227
-
228
-
229
-
230
-
231
-
232
-
233
-
234
-
235
-
236
-
237
-
238
-
239
-
240
-
241
-
242
-
243
-
244
-
245
-
246
-
247
-
248
-
249
-
250
-
251
-
252
-
253
-
254
-
255
-
256
-
257
-
258
-
259
-
260
-
261
-
262
-
263
-
264
-
265
-
266
-
267
-
268
 |
 |

13.6
Capital Management (continued)
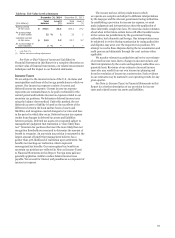
Table 60: Analysis of Changes in Capital Under Basel III (General Approach)
(in billions)
Common Equity Tier 1 at December 31, 2013 $ 123.5
Net income 21.8
Common stock dividends (7.1)
Common stock issued, repurchased, and stock compensation-related items (5.4)
Goodwill and other intangible assets (net of any associated deferred tax liabilities) 3.3
Other 1.0
Change in Common Equity Tier 1
Common Equity Tier 1 at December 31, 2014 $ 137.1
Tier 1 capital at December 31, 2013 $ 140.7
Change in Common Equity Tier 1 13.6
Issuance of noncumulative perpetual preferred 2.8
Other (2.4)
Change in Tier 1 capital
Tier 1 capital at December 31, 2014 (A) $ 154.7
Tier 2 capital at December 31, 2013 $ 35.5
Change in long-term debt and other instruments qualifying as Tier 2 4.5
Change in qualifying allowance for credit losses (1.1)
Other (0.7)
Change in Tier 2 capital
Tier 2 capital at December 31, 2014 (B)
Total qualifying capital (A) + (B) $ 192.9
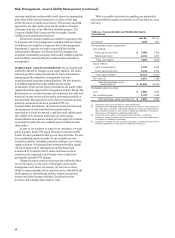
Table 61 presents information on the components of RWAs 2014 were determined under Basel I, and RWAs in 2014 reflect
included within our regulatory capital ratios. RWAs prior to the transition to Basel III (General Approach).
Table 61: RWAs
Under Basel III
(General Under
Approach) (1) Basel I
Dec 31, Dec 31,
(in millions) 2014
On-balance sheet RWAs
Investment securities $ 85,501 93,445
Securities financing transactions (1) 12,369 10,385
Loans (2) 726,008 680,953
Market risk (3) 49,613 36,339
Other 112,619 91,788
Total on-balance sheet RWAs 986,110 912,910
Off-balance sheet RWAs
Commitments and guarantees (4) 218,884 199,197
Derivatives 10,314 10,545
Other 27,237 18,862
Total off-balance sheet RWAs 256,435 228,604
Total RWAs $ 1,242,545 1,141,514
(1) Represents federal funds sold and securities purchased under resale agreements.
(2) Represents loans held for sale and loans held for investment.
(3) Represents regulatory ‘covered’ positions within trading assets and liabilities.
(4) Primarily includes financial standby letters of credit and other unused commitments.
14.0
2.7
38.2
2013
104