Wells Fargo 2014 Annual Report Download - page 63
Download and view the complete annual report
Please find page 63 of the 2014 Wells Fargo annual report below. You can navigate through the pages in the report by either clicking on the pages listed below, or by using the keyword search tool below to find specific information within the annual report.-
 1
1 -
2
-
3
-
4
-
5
-
6
-
7
-
8
-
9
-
10
-
11
-
12
-
13
-
14
-
15
-
16
-
17
-
18
-
19
-
20
-
21
-
22
-
23
-
24
-
25
-
26
-
27
-
28
-
29
-
30
-
31
-
32
-
33
-
34
-
35
-
36
-
37
-
38
-
39
-
40
-
41
-
42
-
43
-
44
-
45
-
46
-
47
-
48
-
49
-
50
-
51
-
52
-
 53
53 -
 54
54 -
 55
55 -
 56
56 -
 57
57 -
 58
58 -
 59
59 -
 60
60 -
 61
61 -
 62
62 -
 63
63 -
 64
64 -
 65
65 -
 66
66 -
 67
67 -
 68
68 -
 69
69 -
 70
70 -
 71
71 -
 72
72 -
 73
73 -
74
-
75
-
76
-
77
-
78
-
79
-
80
-
81
-
82
-
83
-
84
-
85
-
86
-
87
-
88
-
89
-
90
-
91
-
92
-
93
-
94
-
95
-
96
-
97
-
98
-
99
-
100
-
101
-
102
-
103
-
104
-
105
-
106
-
107
-
108
-
109
-
110
-
111
-
112
-
113
-
114
-
115
-
116
-
117
-
118
-
119
-
120
-
121
-
122
-
123
-
124
-
125
-
126
-
127
-
128
-
129
-
130
-
131
-
132
-
133
-
134
-
135
-
136
-
137
-
138
-
139
-
140
-
141
-
142
-
143
-
144
-
145
-
146
-
147
-
148
-
149
-
150
-
151
-
152
-
153
-
154
-
155
-
156
-
157
-
158
-
159
-
160
-
161
-
162
-
163
-
164
-
165
-
166
-
167
-
168
-
169
-
170
-
171
-
172
-
173
-
174
-
175
-
176
-
177
-
178
-
179
-
180
-
181
-
182
-
183
-
184
-
185
-
186
-
187
-
188
-
189
-
190
-
191
-
192
-
193
-
194
-
195
-
196
-
197
-
198
-
199
-
200
-
201
-
202
-
203
-
204
-
205
-
206
-
207
-
208
-
209
-
210
-
211
-
212
-
213
-
214
-
215
-
216
-
217
-
218
-
219
-
220
-
221
-
222
-
223
-
224
-
225
-
226
-
227
-
228
-
229
-
230
-
231
-
232
-
233
-
234
-
235
-
236
-
237
-
238
-
239
-
240
-
241
-
242
-
243
-
244
-
245
-
246
-
247
-
248
-
249
-
250
-
251
-
252
-
253
-
254
-
255
-
256
-
257
-
258
-
259
-
260
-
261
-
262
-
263
-
264
-
265
-
266
-
267
-
268
 |
 |

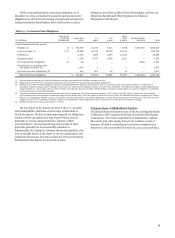
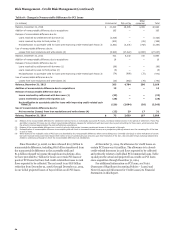
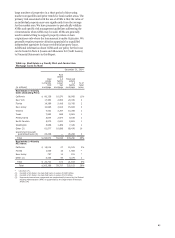
Table 19: Actual and Projected Loss Results on PCI Loans Since Acquisition of Wachovia
Other
(in millions) Commercial Pick-a-Pay consumer Total
Release of nonaccretable difference due to:
Loans resolved by settlement with borrower (1) $ 1,545 — — 1,545
Loans resolved by sales to third parties (2) 336 — 85 421
Reclassification to accretable yield for loans with improving credit-related cash flows (3) 1,734 5,991 843 8,568
Total releases of nonaccretable difference due to better than expected losses 3,615 5,991 928 10,534
Provision for losses due to credit deterioration (4) (1,629) — (104) (1,733)
Actual and projected losses on PCI loans less than originally expected $ 1,986 5,991 824 8,801
(1) Release of the nonaccretable difference for settlement with borrower, on individually accounted PCI loans, increases interest income in the period of settlement. Pick-a-Pay
and Other consumer PCI loans do not reflect nonaccretable difference releases for settlements with borrowers due to pool accounting for those loans, which assumes that
the amount received approximates the pool performance expectations.
(2) Release of the nonaccretable difference as a result of sales to third parties increases noninterest income in the period of the sale.
(3) Reclassification of nonaccretable difference to accretable yield will result in increased interest income as a prospective yield adjustment over the remaining life of the loan
or pool of loans.
(4) Provision for additional losses is recorded as a charge to income when it is estimated that the cash flows expected to be collected for a PCI loan or pool of loans may not
support full realization of the carrying value.
Significant Loan Portfolio Reviews Measuring and
monitoring our credit risk is an ongoing process that tracks
delinquencies, collateral values, FICO scores, economic trends
by geographic areas, loan-level risk grading for certain portfolios
(typically commercial) and other indications of credit risk. Our
credit risk monitoring process is designed to enable early
identification of developing risk and to support our
determination of an appropriate allowance for credit losses. The
following discussion provides additional characteristics and
analysis of our significant portfolios. See Note 6 (Loans and
Allowance for Credit Losses) to Financial Statements in this
Report for more analysis and credit metric information for each
of the following portfolios.
COMMERCIAL AND INDUSTRIAL LOANS AND LEASE
FINANCING For purposes of portfolio risk management, we
aggregate commercial and industrial loans and lease financing
according to market segmentation and standard industry
codes. We generally subject commercial and industrial loans and
lease financing to individual risk assessment using our internal
borrower and collateral quality ratings. Our ratings are aligned
to regulatory definitions of pass and criticized categories with
criticized divided between special mention, substandard,
doubtful and loss categories.
The commercial and industrial loans and lease financing
portfolio totaled $284.1 billion or 33% of total loans at
December 31, 2014. The net charge-off rate for this portfolio was
0.10% in 2014 compared with 0.15% in 2013. At December 31,
2014, 0.20% of this portfolio was nonaccruing, compared with
0.32% at December 31, 2013. In addition, $16.7 billion of this
portfolio was rated as criticized in accordance with regulatory
guidance at December 31, 2014, compared with $17.5 billion at
December 31, 2013.
A majority of our commercial and industrial loans and lease
financing portfolio is secured by short-term assets, such as
accounts receivable, inventory and securities, as well as long-
lived assets, such as equipment and other business assets.
Generally, the collateral securing this portfolio represents a
secondary source of repayment.
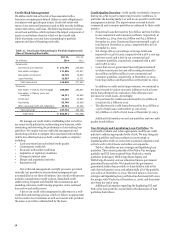
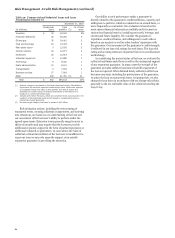
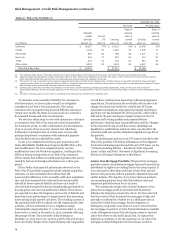
Table 20 provides a breakout of commercial and industrial
loans and lease financing by industry, and includes $45.0 billion
of foreign loans at December 31, 2014, that were reported in a
separate foreign loan class in prior periods. Foreign loans totaled
$14.9 billion within the investors category, $18.1 billion within
the financial institutions category and $1.3 billion within the oil
and gas category.
The investors category includes loans to special purpose
vehicles (SPVs) formed by sponsoring entities to invest in
financial assets backed predominantly by commercial and
residential real estate or corporate cash flow, and are repaid
from the asset cash flows or the sale of assets by the SPV. We
limit loan amounts to a percentage of the value of the underlying
assets, as determined by us, based primarily on analysis of
underlying credit risk and other factors such as asset duration
and ongoing performance.
The $18.1 billion of foreign loans in the financial institutions
category were primarily originated by our Global Financial
Institutions (GFI) business. GFI has relationships with over
1,500 financial institutions, many of which are headquartered
outside the U.S., and for whom we provide a variety of
relationship focused products and services, including loans
supporting short-term trade finance and working capital needs.
Slightly more than half of our oil and gas loans were to
businesses in the exploration and production (E&P) sector.
Nearly all of these E&P loans are secured by oil and/or gas
reserves and have underlying borrowing base arrangements
which include regular (typically semi-annual)
“redeterminations” that consider refinements to borrowing
structure and prices used to determine borrowing limits. The
remainder of the oil and gas loans were to midstream and
services and equipment companies.
61