Wells Fargo 2014 Annual Report Download - page 48
Download and view the complete annual report
Please find page 48 of the 2014 Wells Fargo annual report below. You can navigate through the pages in the report by either clicking on the pages listed below, or by using the keyword search tool below to find specific information within the annual report.-
 1
1 -
2
-
3
-
4
-
5
-
6
-
7
-
8
-
9
-
10
-
11
-
12
-
13
-
14
-
15
-
16
-
17
-
18
-
19
-
20
-
21
-
22
-
23
-
24
-
25
-
26
-
27
-
28
-
29
-
30
-
31
-
32
-
33
-
34
-
35
-
36
-
37
-
 38
38 -
 39
39 -
 40
40 -
 41
41 -
 42
42 -
 43
43 -
 44
44 -
 45
45 -
 46
46 -
 47
47 -
 48
48 -
 49
49 -
 50
50 -
 51
51 -
 52
52 -
 53
53 -
 54
54 -
 55
55 -
 56
56 -
 57
57 -
 58
58 -
59
-
60
-
61
-
62
-
63
-
64
-
65
-
66
-
67
-
68
-
69
-
70
-
71
-
72
-
73
-
74
-
75
-
76
-
77
-
78
-
79
-
80
-
81
-
82
-
83
-
84
-
85
-
86
-
87
-
88
-
89
-
90
-
91
-
92
-
93
-
94
-
95
-
96
-
97
-
98
-
99
-
100
-
101
-
102
-
103
-
104
-
105
-
106
-
107
-
108
-
109
-
110
-
111
-
112
-
113
-
114
-
115
-
116
-
117
-
118
-
119
-
120
-
121
-
122
-
123
-
124
-
125
-
126
-
127
-
128
-
129
-
130
-
131
-
132
-
133
-
134
-
135
-
136
-
137
-
138
-
139
-
140
-
141
-
142
-
143
-
144
-
145
-
146
-
147
-
148
-
149
-
150
-
151
-
152
-
153
-
154
-
155
-
156
-
157
-
158
-
159
-
160
-
161
-
162
-
163
-
164
-
165
-
166
-
167
-
168
-
169
-
170
-
171
-
172
-
173
-
174
-
175
-
176
-
177
-
178
-
179
-
180
-
181
-
182
-
183
-
184
-
185
-
186
-
187
-
188
-
189
-
190
-
191
-
192
-
193
-
194
-
195
-
196
-
197
-
198
-
199
-
200
-
201
-
202
-
203
-
204
-
205
-
206
-
207
-
208
-
209
-
210
-
211
-
212
-
213
-
214
-
215
-
216
-
217
-
218
-
219
-
220
-
221
-
222
-
223
-
224
-
225
-
226
-
227
-
228
-
229
-
230
-
231
-
232
-
233
-
234
-
235
-
236
-
237
-
238
-
239
-
240
-
241
-
242
-
243
-
244
-
245
-
246
-
247
-
248
-
249
-
250
-
251
-
252
-
253
-
254
-
255
-
256
-
257
-
258
-
259
-
260
-
261
-
262
-
263
-
264
-
265
-
266
-
267
-
268
 |
 |
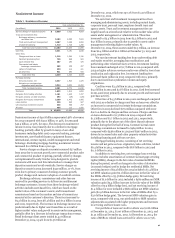
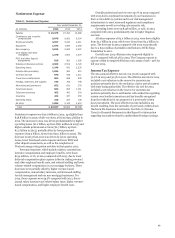
Earnings Performance (continued)
Community Banking reported net income of $14.2 billion in
2014, up $1.4 billion, or 11%, from $12.7 billion in 2013, which
was up 21% from $10.5 billion in 2012. Revenue was
$50.9 billion in 2014, an increase of $523 million, or 1%,
compared with $50.3 billion in 2013, which was down 6%
compared with $53.4 billion in 2012. The increase in revenue for
2014 was primarily driven by higher net interest income, gains
on sale of equity investments and debt securities, higher trust
and investment fees, and higher card fees, partially offset by
lower mortgage banking revenue, the phase out of the direct
deposit advance product during the first half of 2014, and lower
deferred compensation plan investment gains (offset in
employee benefits expense). Higher other income for 2014
compared with a year ago reflected larger ineffectiveness gains
on derivatives that qualify for hedge accounting and a gain on
sale of government guaranteed student loans in fourth quarter
2014. The decrease in 2013 was a result of lower mortgage
banking revenue, partially offset by higher trust and investment
fees, and revenue from debit, credit and merchant card volumes.
Lower other segment income for 2013 compared with 2012 was
due to larger ineffectiveness losses on derivatives that qualify for
hedge accounting and interest-related valuation changes on
certain mortgage-related assets carried at fair value. Average
core deposits increased $22.2 billion in 2014, or 4%, from 2013,
which increased $28.9 billion, or 5%, from 2012. Noninterest
expense decreased $597 million in 2014, or 2%, from 2013,
which declined $2.1 billion, or 7%, from 2012. The decrease in
noninterest expense for 2014 largely reflected lower mortgage
volume-related expenses and deferred compensation expense
(offset in revenue), partially offset by higher operating losses.
The decrease in noninterest expense for 2013 reflected lower
FDIC and other deposit insurance assessments primarily due to
lower FDIC assessment rates. The provision for credit losses of
$1.7 billion in 2014 was 39% lower than 2013, which was
$2.8 billion, or 60%, lower than 2012, due to improved
performance of the consumer real estate portfolio in both 2014
and 2013.
WHOLESALE BANKING provides financial solutions to
businesses across the United States and globally with annual
sales generally in excess of $20 million. Products and business
segments include Middle Market Commercial Banking,
Government and Institutional Banking, Corporate Banking,
Commercial Real Estate, Treasury Management, Wells Fargo
Capital Finance, Insurance, International, Real Estate Capital
Markets, Commercial Mortgage Servicing, Corporate Trust,
Equipment Finance, Wells Fargo Securities, Principal
Investments, Asset Backed Finance, and Asset Management.
Wholesale Banking cross-sell was 7.2 products per relationship
in September 2014, up from 7.1 in September 2013 and 6.8 in
September 2012. Table 9b provides additional financial
information for Wholesale Banking.
46