Wells Fargo 2014 Annual Report Download - page 32
Download and view the complete annual report
Please find page 32 of the 2014 Wells Fargo annual report below. You can navigate through the pages in the report by either clicking on the pages listed below, or by using the keyword search tool below to find specific information within the annual report.-
 1
1 -
2
-
3
-
4
-
5
-
6
-
7
-
8
-
9
-
10
-
11
-
12
-
13
-
14
-
15
-
16
-
17
-
18
-
19
-
20
-
21
-
 22
22 -
 23
23 -
 24
24 -
 25
25 -
 26
26 -
 27
27 -
 28
28 -
 29
29 -
 30
30 -
 31
31 -
 32
32 -
 33
33 -
 34
34 -
 35
35 -
 36
36 -
 37
37 -
 38
38 -
 39
39 -
 40
40 -
 41
41 -
 42
42 -
43
-
44
-
45
-
46
-
47
-
48
-
49
-
50
-
51
-
52
-
53
-
54
-
55
-
56
-
57
-
58
-
59
-
60
-
61
-
62
-
63
-
64
-
65
-
66
-
67
-
68
-
69
-
70
-
71
-
72
-
73
-
74
-
75
-
76
-
77
-
78
-
79
-
80
-
81
-
82
-
83
-
84
-
85
-
86
-
87
-
88
-
89
-
90
-
91
-
92
-
93
-
94
-
95
-
96
-
97
-
98
-
99
-
100
-
101
-
102
-
103
-
104
-
105
-
106
-
107
-
108
-
109
-
110
-
111
-
112
-
113
-
114
-
115
-
116
-
117
-
118
-
119
-
120
-
121
-
122
-
123
-
124
-
125
-
126
-
127
-
128
-
129
-
130
-
131
-
132
-
133
-
134
-
135
-
136
-
137
-
138
-
139
-
140
-
141
-
142
-
143
-
144
-
145
-
146
-
147
-
148
-
149
-
150
-
151
-
152
-
153
-
154
-
155
-
156
-
157
-
158
-
159
-
160
-
161
-
162
-
163
-
164
-
165
-
166
-
167
-
168
-
169
-
170
-
171
-
172
-
173
-
174
-
175
-
176
-
177
-
178
-
179
-
180
-
181
-
182
-
183
-
184
-
185
-
186
-
187
-
188
-
189
-
190
-
191
-
192
-
193
-
194
-
195
-
196
-
197
-
198
-
199
-
200
-
201
-
202
-
203
-
204
-
205
-
206
-
207
-
208
-
209
-
210
-
211
-
212
-
213
-
214
-
215
-
216
-
217
-
218
-
219
-
220
-
221
-
222
-
223
-
224
-
225
-
226
-
227
-
228
-
229
-
230
-
231
-
232
-
233
-
234
-
235
-
236
-
237
-
238
-
239
-
240
-
241
-
242
-
243
-
244
-
245
-
246
-
247
-
248
-
249
-
250
-
251
-
252
-
253
-
254
-
255
-
256
-
257
-
258
-
259
-
260
-
261
-
262
-
263
-
264
-
265
-
266
-
267
-
268
 |
 |

_________________________
This Annual Report, including the Financial Review and the Financial Statements and related Notes, contains forward-looking
statements, which may include forecasts of our financial results and condition, expectations for our operations and business, and our
assumptions for those forecasts and expectations. Do not unduly rely on forward-looking statements. Actual results may differ
materially from our forward-looking statements due to several factors. Factors that could cause our actual results to differ materially
from our forward-looking statements are described in this Report, including in the “Forward-Looking Statements” and “Risk Factors”
sections, and in the “Regulation and Supervision” section of our Annual Report on Form 10-K for the year ended December 31, 2014
(2014 Form 10-K).
When we refer to “Wells Fargo,” “the Company,” “we,” “our” or “us” in this Report, we mean Wells Fargo & Company and Subsidiaries
(consolidated). When we refer to the “Parent,” we mean Wells Fargo & Company. When we refer to “legacy Wells Fargo,” we mean
Wells Fargo excluding Wachovia Corporation (Wachovia). See the Glossary of Acronyms for terms used throughout this Report.
Financial Review1
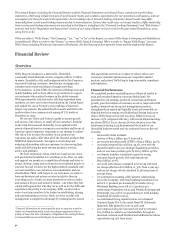
Overview
Wells Fargo & Company is a nationwide, diversified,
community-based financial services company with $1.7 trillion
in assets. Founded in 1852 and headquartered in San Francisco,
we provide banking, insurance, investments, mortgage, and
consumer and commercial finance through more than
8,700 locations, 12,500 ATMs, the internet (wellsfargo.com) and
mobile banking, and we have offices in 36 countries to support
our customers who conduct business in the global economy.
With approximately 265,000 active, full-time equivalent team
members, we serve one in three households in the United States
and ranked No. 29 on Fortune’s 2014 rankings of America’s
largest corporations. We ranked fourth in assets and first in the
market value of our common stock among all U.S. banks at
December 31, 2014.
We use our Vision and Values to guide us toward growth
and success. Our vision is to satisfy all our customers’ financial
needs, help them succeed financially, be recognized as the
premier financial services company in our markets and be one of
America’s great companies. Important to our strategy to achieve
this vision is to increase the number of our products our
customers use and to offer them all of the financial products that
fulfill their financial needs. We aspire to create deep and
enduring relationships with our customers by discovering their
needs and delivering the most relevant products, services,
advice, and guidance.
We have six primary values, which are based on our vision
and provide the foundation for everything we do. First, we value
and support our people as a competitive advantage and strive to
attract, develop, retain and motivate the most talented people we
can find. Second, we strive for the highest ethical standards with
our team members, our customers, our communities and our
shareholders. Third, with respect to our customers, we strive to
base our decisions and actions on what is right for them in
everything we do. Fourth, for team members we strive to build
and sustain a diverse and inclusive culture - one where they feel
valued and respected for who they are as well as for the skills and
experiences they bring to our company. Fifth, we also look to
each of our team members to be leaders in establishing, sharing
and communicating our vision. Sixth, we strive to make risk
management a competitive advantage by working hard to ensure
1
Financial information for certain periods prior to 2014 was revised to
reflect our determination that certain factoring arrangements did not
qualify as loans. See Note 1 (Summary of Significant Accounting Policies)
to Financial Statements in this Report for more information.
that appropriate controls are in place to reduce risks to our
customers, maintain and increase our competitive market
position, and protect Wells Fargo’s long-term safety, soundness
and reputation.
Financial Performance
We completed another outstanding year of financial results in
2014 and remained America’s most profitable bank. We
generated record earnings, produced strong loan and deposit
growth, grew the number of customers we serve, improved credit
quality, enhanced our strong risk management practices,
strengthened our capital and liquidity levels and rewarded our
shareholders by increasing our dividend and buying back more
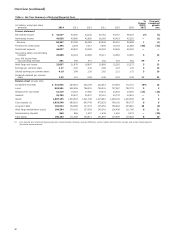
shares. Wells Fargo net income was $23.1 billion in 2014, an
increase of 5% compared with 2013, with record diluted earnings
per share (EPS) of $4.10, also up 5% from the prior year. Our
achievements during 2014 demonstrated the benefit of our
diversified business model and our continued focus on the real
economy.
Noteworthy items included:
• revenue of $84.3 billion, up 1% from 2013;
• pre-tax pre-provision profit (PTPP) of $35.3 billion, up 1%;
• our loans increased $40.3 billion, up 5%, even with the
planned runoff in our non-strategic/liquidating portfolios,
and our core loan portfolio grew by $60.3 billion, up 8%;
• our deposit franchise continued to generate strong
customer deposit growth, with total deposits up
$89.1 billion, or 8%;
• our credit performance continued to be strong with total
net charge-offs down $1.6 billion, or 35%, from a year ago
and our net charge-off ratio declined to 35 basis points of
average loans;
• we continued to maintain solid customer relationships
across the Company, with retail banking household cross-
sell of 6.17 products per household (November 2014);
Wholesale Banking cross-sell of 7.2 products per
relationship (September 2014); and Wealth, Brokerage and
Retirement cross-sell of 10.49 products per retail banking
household (November 2014);
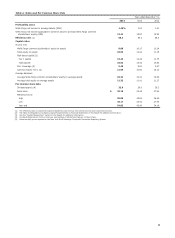
• we maintained strong capital levels as our estimated
Common Equity Tier I ratio under Basel III (Advanced
Approach, fully phased-in) was 10.43%; and
• our common stock price increased 21% and we returned
$12.5 billion in capital to our shareholders through an
increased common stock dividend and additional net share
repurchases (up 74% from 2013).
30