Wells Fargo 2014 Annual Report Download - page 170
Download and view the complete annual report
Please find page 170 of the 2014 Wells Fargo annual report below. You can navigate through the pages in the report by either clicking on the pages listed below, or by using the keyword search tool below to find specific information within the annual report.-
 1
1 -
2
-
3
-
4
-
5
-
6
-
7
-
8
-
9
-
10
-
11
-
12
-
13
-
14
-
15
-
16
-
17
-
18
-
19
-
20
-
21
-
22
-
23
-
24
-
25
-
26
-
27
-
28
-
29
-
30
-
31
-
32
-
33
-
34
-
35
-
36
-
37
-
38
-
39
-
40
-
41
-
42
-
43
-
44
-
45
-
46
-
47
-
48
-
49
-
50
-
51
-
52
-
53
-
54
-
55
-
56
-
57
-
58
-
59
-
60
-
61
-
62
-
63
-
64
-
65
-
66
-
67
-
68
-
69
-
70
-
71
-
72
-
73
-
74
-
75
-
76
-
77
-
78
-
79
-
80
-
81
-
82
-
83
-
84
-
85
-
86
-
87
-
88
-
89
-
90
-
91
-
92
-
93
-
94
-
95
-
96
-
97
-
98
-
99
-
100
-
101
-
102
-
103
-
104
-
105
-
106
-
107
-
108
-
109
-
110
-
111
-
112
-
113
-
114
-
115
-
116
-
117
-
118
-
119
-
120
-
121
-
122
-
123
-
124
-
125
-
126
-
127
-
128
-
129
-
130
-
131
-
132
-
133
-
134
-
135
-
136
-
137
-
138
-
139
-
140
-
141
-
142
-
143
-
144
-
145
-
146
-
147
-
148
-
149
-
150
-
151
-
152
-
153
-
154
-
155
-
156
-
157
-
158
-
159
-
 160
160 -
 161
161 -
 162
162 -
 163
163 -
 164
164 -
 165
165 -
 166
166 -
 167
167 -
 168
168 -
 169
169 -
 170
170 -
 171
171 -
 172
172 -
 173
173 -
 174
174 -
 175
175 -
 176
176 -
 177
177 -
 178
178 -
 179
179 -
 180
180 -
181
-
182
-
183
-
184
-
185
-
186
-
187
-
188
-
189
-
190
-
191
-
192
-
193
-
194
-
195
-
196
-
197
-
198
-
199
-
200
-
201
-
202
-
203
-
204
-
205
-
206
-
207
-
208
-
209
-
210
-
211
-
212
-
213
-
214
-
215
-
216
-
217
-
218
-
219
-
220
-
221
-
222
-
223
-
224
-
225
-
226
-
227
-
228
-
229
-
230
-
231
-
232
-
233
-
234
-
235
-
236
-
237
-
238
-
239
-
240
-
241
-
242
-
243
-
244
-
245
-
246
-
247
-
248
-
249
-
250
-
251
-
252
-
253
-
254
-
255
-
256
-
257
-
258
-
259
-
260
-
261
-
262
-
263
-
264
-
265
-
266
-
267
-
268
 |
 |

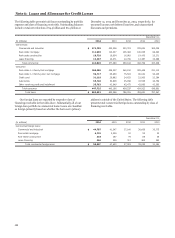
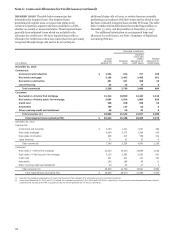
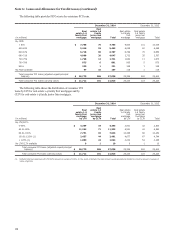
Note 6: Loans and Allowance for Credit Losses (continued)
December 31, 2014 December 31, 2013
Real
Real estate 1-4 Real estate Real estate
estate 1-4
family first family
junior lien 1-4 family
first 1-4 family
junior lien
(in millions) mortgage
by LTV mortgage
by CLTV Total mortgage
by LTV mortgage
by CLTV Total
By LTV/CLTV:
0-60% $ 95,719 15,603 111,322 74,047 13,645 87,692
60.01-80% 86,112 17,651 103,763 80,187 17,154 97,341
80.01-100% 25,170 14,004 39,174 30,842 16,273 47,115
100.01-120% (1) 6,133 7,254 13,387 10,678 9,992 20,670
> 120% (1) 2,856 4,058 6,914 6,306 7,369 13,675
No LTV/CLTV available 1,416 1,046 2,462 1,610 1,394 3,004
Government insured/guaranteed loans (2) 26,268 — 26,268 30,737 — 30,737
Total consumer loans (excluding PCI) 243,674 59,616 303,290 234,407 65,827 300,234
Total consumer PCI loans (carrying value) 21,712 101 21,813 24,100 123 24,223
Total consumer loans $ 265,386 59,717 325,103 258,507 65,950 324,457
(1) Reflects total loan balances with LTV/CLTV amounts in excess of 100%. In the event of default, the loss content would generally be limited to only the amount in excess of
100% LTV/CLTV.
(2) Represents loans whose repayments are predominantly insured by the FHA or guaranteed by the VA.
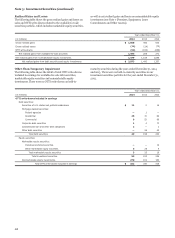
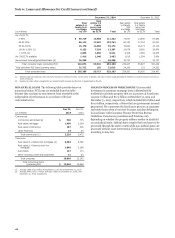
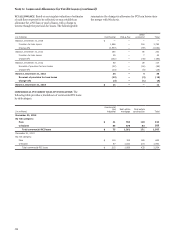
NONACCRUAL LOANS The following table provides loans on LOANS IN PROCESS OF FORECLOSURE Our recorded
nonaccrual status. PCI loans are excluded from this table investment in consumer mortgage loans collateralized by
because they continue to earn interest from accretable yield, residential real estate property that are in process of foreclosure
independent of performance in accordance with their was $12.7 billion and $17.3 billion at December 31, 2014 and
contractual terms. December 31, 2013, respectively, which included $6.6 billion and
$10.0 billion, respectively, of loans that are government insured/
guaranteed. We commence the foreclosure process on consumer
Dec 31, Dec 31, real estate loans when a borrower becomes 120 days delinquent
(in millions) 2014 2013 in accordance with Consumer Finance Protection Bureau
Commercial: Guidelines. Foreclosure procedures and timelines vary
Commercial and industrial $ 538 775 depending on whether the property address resides in a judicial
or non-judicial state. Judicial states require the foreclosure to be
Real estate mortgage 1,490 2,254 processed through the state's courts while non-judicial states are
Real estate construction 187 416 processed without court intervention. Foreclosure timelines vary
Lease financing 24 30 according to state law.
Total commercial (1) 2,239 3,475
Consumer:
Real estate 1-4 family first mortgage (2) 8,583 9,799
Real estate 1-4 family junior lien
mortgage 1,848 2,188
Automobile 137 173
Other revolving credit and installment 41 33
Total consumer 10,609 12,193
Total nonaccrual loans
(excluding PCI) $ 12,848 15,668
(1) Includes LHFS of $1 million at December 31, 2014 and December 31, 2013.
(2) Includes MHFS of $177 million and $227 million at December 31, 2014, and
December 31, 2013, respectively.
168