Wells Fargo 2014 Annual Report Download - page 94
Download and view the complete annual report
Please find page 94 of the 2014 Wells Fargo annual report below. You can navigate through the pages in the report by either clicking on the pages listed below, or by using the keyword search tool below to find specific information within the annual report.-
 1
1 -
2
-
3
-
4
-
5
-
6
-
7
-
8
-
9
-
10
-
11
-
12
-
13
-
14
-
15
-
16
-
17
-
18
-
19
-
20
-
21
-
22
-
23
-
24
-
25
-
26
-
27
-
28
-
29
-
30
-
31
-
32
-
33
-
34
-
35
-
36
-
37
-
38
-
39
-
40
-
41
-
42
-
43
-
44
-
45
-
46
-
47
-
48
-
49
-
50
-
51
-
52
-
53
-
54
-
55
-
56
-
57
-
58
-
59
-
60
-
61
-
62
-
63
-
64
-
65
-
66
-
67
-
68
-
69
-
70
-
71
-
72
-
73
-
74
-
75
-
76
-
77
-
78
-
79
-
80
-
81
-
82
-
83
-
 84
84 -
 85
85 -
 86
86 -
 87
87 -
 88
88 -
 89
89 -
 90
90 -
 91
91 -
 92
92 -
 93
93 -
 94
94 -
 95
95 -
 96
96 -
 97
97 -
 98
98 -
 99
99 -
 100
100 -
 101
101 -
 102
102 -
 103
103 -
 104
104 -
105
-
106
-
107
-
108
-
109
-
110
-
111
-
112
-
113
-
114
-
115
-
116
-
117
-
118
-
119
-
120
-
121
-
122
-
123
-
124
-
125
-
126
-
127
-
128
-
129
-
130
-
131
-
132
-
133
-
134
-
135
-
136
-
137
-
138
-
139
-
140
-
141
-
142
-
143
-
144
-
145
-
146
-
147
-
148
-
149
-
150
-
151
-
152
-
153
-
154
-
155
-
156
-
157
-
158
-
159
-
160
-
161
-
162
-
163
-
164
-
165
-
166
-
167
-
168
-
169
-
170
-
171
-
172
-
173
-
174
-
175
-
176
-
177
-
178
-
179
-
180
-
181
-
182
-
183
-
184
-
185
-
186
-
187
-
188
-
189
-
190
-
191
-
192
-
193
-
194
-
195
-
196
-
197
-
198
-
199
-
200
-
201
-
202
-
203
-
204
-
205
-
206
-
207
-
208
-
209
-
210
-
211
-
212
-
213
-
214
-
215
-
216
-
217
-
218
-
219
-
220
-
221
-
222
-
223
-
224
-
225
-
226
-
227
-
228
-
229
-
230
-
231
-
232
-
233
-
234
-
235
-
236
-
237
-
238
-
239
-
240
-
241
-
242
-
243
-
244
-
245
-
246
-
247
-
248
-
249
-
250
-
251
-
252
-
253
-
254
-
255
-
256
-
257
-
258
-
259
-
260
-
261
-
262
-
263
-
264
-
265
-
266
-
267
-
268
 |
 |

Risk Management - Asset/Liability Management (continued)
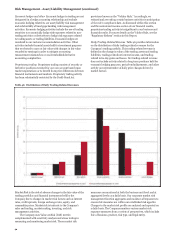
An inventory of scenarios is maintained representing both
historical and hypothetical stress events that affect a broad range
of market risk factors with varying degrees of correlation and
differing time horizons. Hypothetical scenarios assess the impact
of large movements in financial variables on portfolio values.
Typical examples include a 100 basis point increase across the
yield curve or a 10% decline in stock market indexes. Historical
scenarios utilize an event-driven approach: the stress scenarios
are based on plausible but rare events, and the analysis
addresses how these events might affect the risk factors relevant
to a portfolio.
The Company’s stress testing framework is also used in
calculating results in support of the Federal Reserve Board’s
Comprehensive Capital Analysis & Review (CCAR) and internal
stress tests. Stress scenarios are regularly reviewed and updated
to address potential market events or concerns. For more detail
on the CCAR process, see the “Capital Management” section in
this Report.
Regulatory Market Risk Capital is based on U.S. regulatory
agency risk-based capital regulations that are based on the Basel
Committee Capital Accord of the Basel Committee on Banking
Supervision. Prior to January 1, 2013, U.S. banking regulators’
market risk capital requirements were subject to Basel I and
thereafter based on Basel 2.5. Effective January 1, 2014, the
Company must calculate regulatory capital based on the Basel III
market risk capital rule, which integrated Basel 2.5, and requires
banking organizations with significant trading activities to adjust
their capital requirements to better account for the market risks
of those activities based on a comprehensive and risk sensitive
method and models. The market risk capital rule is intended to
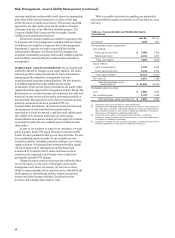
Table 48: Market Risk Regulatory Capital and RWAs
cover the risk of loss in value of covered positions due to changes
in market conditions.
Composition of Material Portfolio of Covered Positions The
market risk capital rule substantially modified the determination
of market risk risk-weighted assets (RWAs), and implemented a
more risk-sensitive methodology for the risks inherent in certain
“covered” trading positions. The positions that are “covered” by
the market risk capital rule are generally a subset of our trading
assets and trading liabilities, specifically those held by the
Company for the purpose of short-term resale or with the intent
of benefiting from actual or expected short-term price
movements, or to lock in arbitrage profits. Positions excluded
from market risk regulatory capital treatment are subject to the
credit risk capital rules applicable to the “non-covered” trading
positions.
The material portfolio of the Company’s “covered” positions
is predominantly concentrated in the trading assets and trading
liabilities managed within Wholesale Banking where the
substantial portion of market risk capital is required. Wholesale
Banking engages in the fixed income, traded credit, foreign
exchange, equities, and commodities markets businesses. Other
business segments hold small additional trading positions
covered under the market risk capital rule.
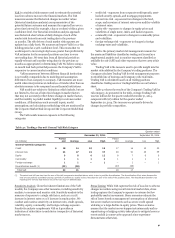
Table 48 summarizes the market risk-based capital
requirements charge and market RWAs in accordance with the
Basel III market risk capital rule as of December 31, 2014, and in
accordance with the Basel 2.5 market risk capital rule as of
December 31, 2013. The market RWAs are calculated as the sum
of the components in the table below.
December 31, 2014 December 31, 2013
(in millions)
Total VaR $
Risk-
based
capital
146
Risk-
weighted
assets
1,822
Risk-
based
capital
252
Risk-
weighted
assets
3,149
Total Stressed VaR 1,469 18,359 921 11,512
Incremental Risk Charge
Securitized Products Charge
Standard Specific Risk Charge
De minimis Charges (positions not included in models)
345
766
1,177
66
4,317
9,577
14,709
829
393
633
583
125
4,913
7,913
7,289
1,563
Total $ 3,969 49,613 2,907 36,339
92