Wells Fargo 2014 Annual Report Download - page 53
Download and view the complete annual report
Please find page 53 of the 2014 Wells Fargo annual report below. You can navigate through the pages in the report by either clicking on the pages listed below, or by using the keyword search tool below to find specific information within the annual report.-
 1
1 -
2
-
3
-
4
-
5
-
6
-
7
-
8
-
9
-
10
-
11
-
12
-
13
-
14
-
15
-
16
-
17
-
18
-
19
-
20
-
21
-
22
-
23
-
24
-
25
-
26
-
27
-
28
-
29
-
30
-
31
-
32
-
33
-
34
-
35
-
36
-
37
-
38
-
39
-
40
-
41
-
42
-
 43
43 -
 44
44 -
 45
45 -
 46
46 -
 47
47 -
 48
48 -
 49
49 -
 50
50 -
 51
51 -
 52
52 -
 53
53 -
 54
54 -
 55
55 -
 56
56 -
 57
57 -
 58
58 -
 59
59 -
 60
60 -
 61
61 -
 62
62 -
 63
63 -
64
-
65
-
66
-
67
-
68
-
69
-
70
-
71
-
72
-
73
-
74
-
75
-
76
-
77
-
78
-
79
-
80
-
81
-
82
-
83
-
84
-
85
-
86
-
87
-
88
-
89
-
90
-
91
-
92
-
93
-
94
-
95
-
96
-
97
-
98
-
99
-
100
-
101
-
102
-
103
-
104
-
105
-
106
-
107
-
108
-
109
-
110
-
111
-
112
-
113
-
114
-
115
-
116
-
117
-
118
-
119
-
120
-
121
-
122
-
123
-
124
-
125
-
126
-
127
-
128
-
129
-
130
-
131
-
132
-
133
-
134
-
135
-
136
-
137
-
138
-
139
-
140
-
141
-
142
-
143
-
144
-
145
-
146
-
147
-
148
-
149
-
150
-
151
-
152
-
153
-
154
-
155
-
156
-
157
-
158
-
159
-
160
-
161
-
162
-
163
-
164
-
165
-
166
-
167
-
168
-
169
-
170
-
171
-
172
-
173
-
174
-
175
-
176
-
177
-
178
-
179
-
180
-
181
-
182
-
183
-
184
-
185
-
186
-
187
-
188
-
189
-
190
-
191
-
192
-
193
-
194
-
195
-
196
-
197
-
198
-
199
-
200
-
201
-
202
-
203
-
204
-
205
-
206
-
207
-
208
-
209
-
210
-
211
-
212
-
213
-
214
-
215
-
216
-
217
-
218
-
219
-
220
-
221
-
222
-
223
-
224
-
225
-
226
-
227
-
228
-
229
-
230
-
231
-
232
-
233
-
234
-
235
-
236
-
237
-
238
-
239
-
240
-
241
-
242
-
243
-
244
-
245
-
246
-
247
-
248
-
249
-
250
-
251
-
252
-
253
-
254
-
255
-
256
-
257
-
258
-
259
-
260
-
261
-
262
-
263
-
264
-
265
-
266
-
267
-
268
 |
 |

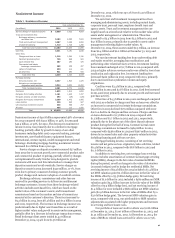
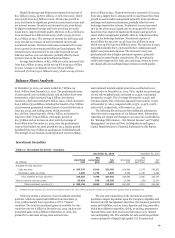
Loan Portfolio
Total loans were $862.6 billion at December 31, 2014, up 5%
from December 31, 2013. Table 12 provides a summary of total
outstanding loans by non-strategic/liquidating and core loan
portfolios. The decrease in the non-strategic/liquidating
portfolios was $20.1 billion, while loans in the core portfolio
grew $60.3 billion from December 31, 2013. Our core loan
growth during 2014 included:
• a $38.6 billion increase in commercial loans, reflecting
broad-based growth in our portfolios, including $6.5 billion
from the financing related to the sale of government
guaranteed student loans out of loans held for sale in fourth
quarter 2014. For additional information on the government
guaranteed student loan sale, see Note 8 (Securitizations
and Variable Interest Entities) to Financial Statements in
this Report; and
Table 12: Loan Portfolios
• a $21.7 billion increase in consumer loans, predominantly
from growth in the nonconforming mortgage, automobile,
credit card and other revolving credit and installment loan
portfolios, partially offset by a decrease in the real estate 1-4
family junior lien mortgage portfolio and the transfer of the
government guaranteed student loan portfolio to loans held
for sale at the end of second quarter 2014. The increase in
consumer loans also included the acquisition of an existing
private label and co-branded credit card loan portfolio in
fourth quarter 2014 in connection with the new Dillard's
program agreement.
Additional information on the non-strategic and liquidating
loan portfolios is included in Table 17 in the “Risk Management
– Credit Risk Management” section in this Report.
December 31, 2014 December 31, 2013
(in millions) Core Liquidating Total Core Liquidating Total
Commercial
Consumer
$ 413,701
388,062
1,125
59,663
414,826
447,725
375,077
366,343
2,013
78,853
377,090
445,196
Total loans 801,763 60,788 862,551 741,420 80,866 822,286
Change from prior year $ 60,343 (20,078) 40,265 37,631 (13,696) 23,935
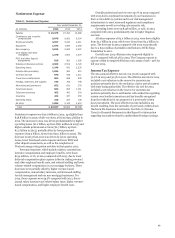
A discussion of average loan balances and a comparative
detail of average loan balances is included in Table 5 under
“Earnings Performance – Net Interest Income” earlier in this
Report. Additional information on total loans outstanding by
portfolio segment and class of financing receivable is included in
the “Risk Management – Credit Risk Management” section in
this Report. Period-end balances and other loan related
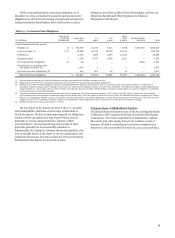
Table 13: Maturities for Selected Commercial Loan Categories
information are in Note 6 (Loans and Allowance for Credit
Losses) to Financial Statements in this Report.
Table 13 shows contractual loan maturities for loan
categories normally not subject to regular periodic principal
reduction and sensitivities of those loans to changes in interest
rates.
December 31, 2014 December 31, 2013
(in millions)
Within
one
year
After
one year
through
five years
After
five
years Total
Within
one
year
After
one year
through
five years
After
five
years Total
Selected loan maturities:
Commercial and industrial $ 76,216 172,801 22,778 271,795 71,921 140,430 23,007 235,358
Real estate mortgage
Real estate construction
17,485
6,079
61,092
11,312
33,419
1,337
111,996
18,728
20,028
6,207
62,965
9,282
29,434
1,445
112,427
16,934
Total selected loans $ 99,780 245,205 57,534 402,519 98,156 212,677 53,886 364,719
Distribution of loans to changes in interest
rates:
Loans at fixed interest rates $ 15,574 25,429 20,002 61,005 14,802 23,846 14,690 53,338
Loans at floating/variable interest rates 84,206 219,776 37,532 341,514 83,354 188,831 39,196 311,381
Total selected loans $ 99,780 245,205 57,534 402,519 98,156 212,677 53,886 364,719
Deposits
Deposits totaled $1.2 trillion at December 31, 2014, compared
with $1.1 trillion at December 31, 2013. Table 14 provides
additional information regarding deposits. Deposit growth of
$89.1 billion from December 31, 2013 reflected continued
customer-driven growth as well as liquidity-related issuances of
term deposits. Information regarding the impact of deposits on
net interest income and a comparison of average deposit
balances is provided in “Earnings Performance – Net Interest
Income” and Table 5 earlier in this Report. Total core deposits
were $1.1 trillion at December 31, 2014, up $74.3 billion from
$980.1 billion at December 31, 2013.
51