Sallie Mae 2010 Annual Report Download - page 95
Download and view the complete annual report
Please find page 95 of the 2010 Sallie Mae annual report below. You can navigate through the pages in the report by either clicking on the pages listed below, or by using the keyword search tool below to find specific information within the annual report.-
 1
1 -
2
-
3
-
4
-
5
-
6
-
7
-
8
-
9
-
10
-
11
-
12
-
13
-
14
-
15
-
16
-
17
-
18
-
19
-
20
-
21
-
22
-
23
-
24
-
25
-
26
-
27
-
28
-
29
-
30
-
31
-
32
-
33
-
34
-
35
-
36
-
37
-
38
-
39
-
40
-
41
-
42
-
43
-
44
-
45
-
46
-
47
-
48
-
49
-
50
-
51
-
52
-
53
-
54
-
55
-
56
-
57
-
58
-
59
-
60
-
61
-
62
-
63
-
64
-
65
-
66
-
67
-
68
-
69
-
70
-
71
-
72
-
73
-
74
-
75
-
76
-
77
-
78
-
79
-
80
-
81
-
82
-
83
-
84
-
 85
85 -
 86
86 -
 87
87 -
 88
88 -
 89
89 -
 90
90 -
 91
91 -
 92
92 -
 93
93 -
 94
94 -
 95
95 -
 96
96 -
 97
97 -
 98
98 -
 99
99 -
 100
100 -
 101
101 -
 102
102 -
 103
103 -
 104
104 -
 105
105 -
106
-
107
-
108
-
109
-
110
-
111
-
112
-
113
-
114
-
115
-
116
-
117
-
118
-
119
-
120
-
121
-
122
-
123
-
124
-
125
-
126
-
127
-
128
-
129
-
130
-
131
-
132
-
133
-
134
-
135
-
136
-
137
-
138
-
139
-
140
-
141
-
142
-
143
-
144
-
145
-
146
-
147
-
148
-
149
-
150
-
151
-
152
-
153
-
154
-
155
-
156
-
157
-
158
-
159
-
160
-
161
-
162
-
163
-
164
-
165
-
166
-
167
-
168
-
169
-
170
-
171
-
172
-
173
-
174
-
175
-
176
-
177
-
178
-
179
-
180
-
181
-
182
-
183
-
184
-
185
-
186
-
187
-
188
-
189
-
190
-
191
-
192
-
193
-
194
-
195
-
196
-
197
-
198
-
199
-
200
-
201
-
202
-
203
-
204
-
205
-
206
-
207
-
208
-
209
-
210
-
211
-
212
-
213
-
214
-
215
-
216
-
217
-
218
-
219
-
220
-
221
-
222
-
223
-
224
-
225
-
226
 |
 |

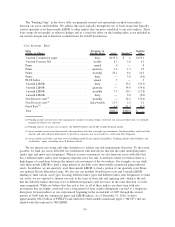
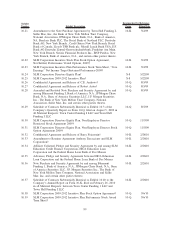
The “Funding Gaps” in the above table are primarily interest rate mismatches in short-term indices
between our assets and liabilities. We address this issue typically through the use of basis swaps that typically
convert quarterly reset three-month LIBOR to other indices that are more correlated to our asset indices. These
basis swaps do not qualify as effective hedges and as a result the effect on the funding index is not included in
our interest margin and is therefore excluded from the GAAP presentation.
“Core Earnings” Basis
Index
(Dollars in billions)
Frequency of
Variable Resets Assets Funding
(1)
Funding
Gap
3-month Commercial paper ................... daily $139.2 $ .1 $139.1
3-month Treasury bill ....................... weekly 8.2 2.0 6.2
Prime ................................... annual .8 — .8
Prime ................................... quarterly 5.4 1.5 3.9
Prime ................................... monthly 23.1 8.6 14.5
Prime ................................... daily — 3.0 (3.0)
PLUS Index .............................. annual .5 — .5
3-month LIBOR ........................... daily — 55.5 (55.5)
3-month LIBOR ........................... quarterly — 54.6 (54.6)
1-month LIBOR ........................... monthly 7.3 20.1 (12.8)
1-month LIBOR ........................... daily — 9.0 (9.0)
Non Discrete reset
(2)
........................ monthly — 34.6 (34.6)
Non Discrete reset
(3)
........................ daily/weekly 11.5 2.3 9.2
Fixed Rate
(4)
............................. 6.6 11.3 (4.7)
Total ................................... $202.6 $202.6 $ —
(1) Funding includes all derivatives that management considers economic hedges of interest rate risk and reflects how we internally
manage our interest rate exposure.
(2) Funding consists of auction rate securities, the ABCP Facilities and the ED Conduit Program facility.
(3) Assets include restricted and unrestricted cash equivalents and other overnight type instruments. Funding includes retail and other
deposits and cash collateral held related to derivatives exposures that are recorded as a short-term debt obligation.
(4) Assets include receivables and other assets (including goodwill and acquired intangibles). Funding includes other liabilities and
stockholders’ equity (excluding series B Preferred Stock).
We use interest rate swaps and other derivatives to achieve our risk management objectives. To the extent
possible, we fund our assets with debt (in combination with derivatives) that has the same underlying index
(index type and index reset frequency). When it is more economical, we also fund our assets with debt that
has a different index and/or reset frequency than the asset, but only in instances where we believe there is a
high degree of correlation between the interest rate movement of the two indices. For example, we use daily
reset three-month LIBOR to fund a large portion of our daily reset three-month commercial paper indexed
assets. In addition, we use quarterly reset three-month LIBOR to fund a portion of our quarterly reset Prime
rate indexed Private Education Loans. We also use our monthly Non-Discrete reset and 1-month LIBOR
funding to fund various asset types. In using different index types and different index reset frequencies to fund
our assets, we are exposed to interest rate risk in the form of basis risk and repricing risk, which is the risk
that the different indices that may reset at different frequencies will not move in the same direction or at the
same magnitude. While we believe that this risk is low, as all of these indices are short-term with rate
movements that are highly correlated over a long period of time, market disruptions can lead to a temporary
divergence between indices as was experienced beginning in the second half of 2007 through the second
quarter of 2009 with the commercial paper and LIBOR indices. As of December 31, 2010, we have
approximately $92.6 billion of FFELP Loans indexed to three-month commercial paper (“3M CP”) that are
funded with debt indexed to 3M LIBOR.
94