Sallie Mae 2010 Annual Report Download - page 182
Download and view the complete annual report
Please find page 182 of the 2010 Sallie Mae annual report below. You can navigate through the pages in the report by either clicking on the pages listed below, or by using the keyword search tool below to find specific information within the annual report.-
 1
1 -
2
-
3
-
4
-
5
-
6
-
7
-
8
-
9
-
10
-
11
-
12
-
13
-
14
-
15
-
16
-
17
-
18
-
19
-
20
-
21
-
22
-
23
-
24
-
25
-
26
-
27
-
28
-
29
-
30
-
31
-
32
-
33
-
34
-
35
-
36
-
37
-
38
-
39
-
40
-
41
-
42
-
43
-
44
-
45
-
46
-
47
-
48
-
49
-
50
-
51
-
52
-
53
-
54
-
55
-
56
-
57
-
58
-
59
-
60
-
61
-
62
-
63
-
64
-
65
-
66
-
67
-
68
-
69
-
70
-
71
-
72
-
73
-
74
-
75
-
76
-
77
-
78
-
79
-
80
-
81
-
82
-
83
-
84
-
85
-
86
-
87
-
88
-
89
-
90
-
91
-
92
-
93
-
94
-
95
-
96
-
97
-
98
-
99
-
100
-
101
-
102
-
103
-
104
-
105
-
106
-
107
-
108
-
109
-
110
-
111
-
112
-
113
-
114
-
115
-
116
-
117
-
118
-
119
-
120
-
121
-
122
-
123
-
124
-
125
-
126
-
127
-
128
-
129
-
130
-
131
-
132
-
133
-
134
-
135
-
136
-
137
-
138
-
139
-
140
-
141
-
142
-
143
-
144
-
145
-
146
-
147
-
148
-
149
-
150
-
151
-
152
-
153
-
154
-
155
-
156
-
157
-
158
-
159
-
160
-
161
-
162
-
163
-
164
-
165
-
166
-
167
-
168
-
169
-
170
-
171
-
 172
172 -
 173
173 -
 174
174 -
 175
175 -
 176
176 -
 177
177 -
 178
178 -
 179
179 -
 180
180 -
 181
181 -
 182
182 -
 183
183 -
 184
184 -
 185
185 -
 186
186 -
 187
187 -
 188
188 -
 189
189 -
 190
190 -
 191
191 -
 192
192 -
193
-
194
-
195
-
196
-
197
-
198
-
199
-
200
-
201
-
202
-
203
-
204
-
205
-
206
-
207
-
208
-
209
-
210
-
211
-
212
-
213
-
214
-
215
-
216
-
217
-
218
-
219
-
220
-
221
-
222
-
223
-
224
-
225
-
226
 |
 |

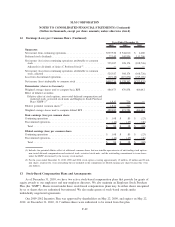
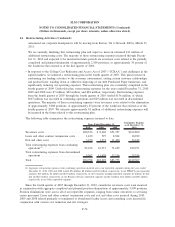
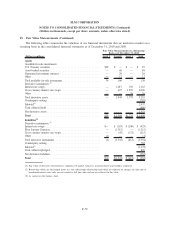
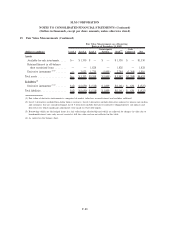
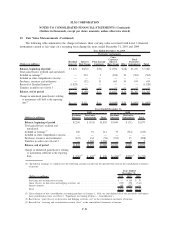
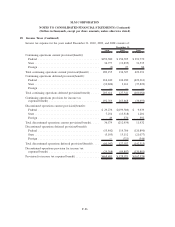
15. Fair Value Measurements (Continued)
The following tables summarize the valuation of our financial instruments that are marked-to-market on a
recurring basis in the consolidated financial statements as of December 31, 2010 and 2009.
(Dollars in millions) Level 1 Level 2 Level 3 Total
Fair Value Measurements on a Recurring
Basis as of December 31, 2010
Assets
Available-for-sale investments:
U.S. Treasury securities . . . . . . . . . . . . . . . . . . . . . . . . . . . . . . . . . $39 $ — $ — $ 39
Asset-backed securities . . . . . . . . . . . . . . . . . . . . . . . . . . . . . . . . . . — 68 — 68
Guaranteed investment contracts . . . . . . . . . . . . . . . . . . . . . . . . . . . — 20 — 20
Other .............................................. — 12 — 12
Total available-for-sale investments . . . . . . . . . . . . . . . . . . . . . . . . . 39 100 — 139
Derivative instruments:
(1)
Interest rate swaps . . . . . . . . . . . . . . . . . . . . . . . . . . . . . . . . . . . . . — 1,017 150 1,167
Cross currency interest rate swaps . . . . . . . . . . . . . . . . . . . . . . . . . . — 427 1,599 2,026
Other .............................................. — — 26 26
Total derivative assets . . . . . . . . . . . . . . . . . . . . . . . . . . . . . . . . . . . — 1,444 1,775 3,219
Counterparty netting . . . . . . . . . . . . . . . . . . . . . . . . . . . . . . . . . . . . (782)
Subtotal
(3)
........................................... 2,437
Cash collateral held . . . . . . . . . . . . . . . . . . . . . . . . . . . . . . . . . . . . (886)
Net derivative assets . . . . . . . . . . . . . . . . . . . . . . . . . . . . . . . . . . . . 1,551
Total . . . . . . . . . . . . . . . . . . . . . . . . . . . . . . . . . . . . . . . . . . . . . . $39 $ 1,544 $1,775 $ 1,690
Liabilities
(2)
Derivative instruments:
(1)
Interest rate swaps . . . . . . . . . . . . . . . . . . . . . . . . . . . . . . . . . . . . . $— $ (183) $ (240) $ (423)
Floor Income Contracts. . . . . . . . . . . . . . . . . . . . . . . . . . . . . . . . . . — (1,315) — (1,315)
Cross currency interest rate swaps . . . . . . . . . . . . . . . . . . . . . . . . . . — (43) (172) (215)
Other .............................................. (1) — — (1)
Total derivative instruments . . . . . . . . . . . . . . . . . . . . . . . . . . . . . . . (1) (1,541) (412) (1,954)
Counterparty netting . . . . . . . . . . . . . . . . . . . . . . . . . . . . . . . . . . . . 782
Subtotal
(3)
. . . . . . . . . . . . . . . . . . . . . . . . . . . . . . . . . . . . . . . . . . . (1,172)
Cash collateral pledged . . . . . . . . . . . . . . . . . . . . . . . . . . . . . . . . . . 809
Net derivative liabilities . . . . . . . . . . . . . . . . . . . . . . . . . . . . . . . . . (363)
Total . . . . . . . . . . . . . . . . . . . . . . . . . . . . . . . . . . . . . . . . . . . . . . $ (1) $(1,541) $ (412) $ (363)
(1) Fair value of derivative instruments is comprised of market value less accrued interest and excludes collateral.
(2) Borrowings which are the hedged items in a fair value hedge relationship and which are adjusted for changes in value due to
benchmark interest rates only are not carried at full fair value and are not reflected in this table.
(3) As carried on the balance sheet.
F-79
SLM CORPORATION
NOTES TO CONSOLIDATED FINANCIAL STATEMENTS (Continued)
(Dollars in thousands, except per share amounts, unless otherwise stated)