Sallie Mae 2010 Annual Report Download - page 107
Download and view the complete annual report
Please find page 107 of the 2010 Sallie Mae annual report below. You can navigate through the pages in the report by either clicking on the pages listed below, or by using the keyword search tool below to find specific information within the annual report.-
 1
1 -
2
-
3
-
4
-
5
-
6
-
7
-
8
-
9
-
10
-
11
-
12
-
13
-
14
-
15
-
16
-
17
-
18
-
19
-
20
-
21
-
22
-
23
-
24
-
25
-
26
-
27
-
28
-
29
-
30
-
31
-
32
-
33
-
34
-
35
-
36
-
37
-
38
-
39
-
40
-
41
-
42
-
43
-
44
-
45
-
46
-
47
-
48
-
49
-
50
-
51
-
52
-
53
-
54
-
55
-
56
-
57
-
58
-
59
-
60
-
61
-
62
-
63
-
64
-
65
-
66
-
67
-
68
-
69
-
70
-
71
-
72
-
73
-
74
-
75
-
76
-
77
-
78
-
79
-
80
-
81
-
82
-
83
-
84
-
85
-
86
-
87
-
88
-
89
-
90
-
91
-
92
-
93
-
94
-
95
-
96
-
 97
97 -
 98
98 -
 99
99 -
 100
100 -
 101
101 -
 102
102 -
 103
103 -
 104
104 -
 105
105 -
 106
106 -
 107
107 -
 108
108 -
 109
109 -
 110
110 -
 111
111 -
 112
112 -
 113
113 -
 114
114 -
 115
115 -
 116
116 -
 117
117 -
118
-
119
-
120
-
121
-
122
-
123
-
124
-
125
-
126
-
127
-
128
-
129
-
130
-
131
-
132
-
133
-
134
-
135
-
136
-
137
-
138
-
139
-
140
-
141
-
142
-
143
-
144
-
145
-
146
-
147
-
148
-
149
-
150
-
151
-
152
-
153
-
154
-
155
-
156
-
157
-
158
-
159
-
160
-
161
-
162
-
163
-
164
-
165
-
166
-
167
-
168
-
169
-
170
-
171
-
172
-
173
-
174
-
175
-
176
-
177
-
178
-
179
-
180
-
181
-
182
-
183
-
184
-
185
-
186
-
187
-
188
-
189
-
190
-
191
-
192
-
193
-
194
-
195
-
196
-
197
-
198
-
199
-
200
-
201
-
202
-
203
-
204
-
205
-
206
-
207
-
208
-
209
-
210
-
211
-
212
-
213
-
214
-
215
-
216
-
217
-
218
-
219
-
220
-
221
-
222
-
223
-
224
-
225
-
226
 |
 |

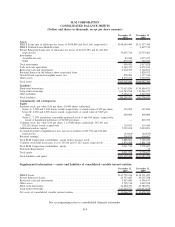
SLM CORPORATION
CONSOLIDATED BALANCE SHEETS
(Dollars and shares in thousands, except per share amounts)
December 31,
2010
December 31,
2009
Assets
FFELP Loans (net of allowance for losses of $188,858 and $161,168, respectively) . . . . . $148,649,400 $111,357,434
FFELP Stafford Loans Held-For-Sale. . . . . . . . . . . . . . . . . . . . . . . . . . . . . . . . . . . . . . — 9,695,714
Private Education Loans (net of allowance for losses of $2,021,580 and $1,443,440,
respectively) . . . . . . . . . . . . . . . . . . . . . . . . . . . . . . . . . . . . . . . . . . . . . . . . . . . . . 35,655,724 22,753,462
Investments
Available-for-sale . . . . . . . . . . . . . . . . . . . . . . . . . . . . . . . . . . . . . . . . . . . . . . . . . . 83,048 1,273,275
Other . . . . . . . . . . . . . . . . . . . . . . . . . . . . . . . . . . . . . . . . . . . . . . . . . . . . . . . . . . 873,376 740,553
Total investments . . . . . . . . . . . . . . . . . . . . . . . . . . . . . . . . . . . . . . . . . . . . . . . . . . . 956,424 2,013,828
Cash and cash equivalents . . . . . . . . . . . . . . . . . . . . . . . . . . . . . . . . . . . . . . . . . . . . . 4,342,327 6,070,013
Restricted cash and investments . . . . . . . . . . . . . . . . . . . . . . . . . . . . . . . . . . . . . . . . . 6,254,493 5,168,871
Retained Interest in off-balance sheet securitized loans . . . . . . . . . . . . . . . . . . . . . . . . . — 1,828,075
Goodwill and acquired intangible assets, net . . . . . . . . . . . . . . . . . . . . . . . . . . . . . . . . . 478,409 1,177,310
Other assets . . . . . . . . . . . . . . . . . . . . . . . . . . . . . . . . . . . . . . . . . . . . . . . . . . . . . . . 8,970,272 9,920,591
Total assets . . . . . . . . . . . . . . . . . . . . . . . . . . . . . . . . . . . . . . . . . . . . . . . . . . . . . . . . $205,307,049 $169,985,298
Liabilities
Short-term borrowings . . . . . . . . . . . . . . . . . . . . . . . . . . . . . . . . . . . . . . . . . . . . . . . . $ 33,615,856 $ 30,896,811
Long-term borrowings . . . . . . . . . . . . . . . . . . . . . . . . . . . . . . . . . . . . . . . . . . . . . . . . 163,543,504 130,546,272
Other liabilities . . . . . . . . . . . . . . . . . . . . . . . . . . . . . . . . . . . . . . . . . . . . . . . . . . . . . 3,136,111 3,263,593
Total liabilities . . . . . . . . . . . . . . . . . . . . . . . . . . . . . . . . . . . . . . . . . . . . . . . . . . . . . 200,295,471 164,706,676
Commitments and contingencies
Equity
Preferred stock, par value $.20 per share, 20,000 shares authorized
Series A: 3,300 and 3,300 shares issued, respectively, at stated value of $50 per share . . 165,000 165,000
Series B: 4,000 and 4,000 shares issued, respectively, at stated value of $100 per
share . . . . . . . . . . . . . . . . . . . . . . . . . . . . . . . . . . . . . . . . . . . . . . . . . . . . . . . . . 400,000 400,000
Series C, 7.25% mandatory convertible preferred stock; 0 and 810 shares, respectively,
issued at liquidation preference of $1,000 per share . . . . . . . . . . . . . . . . . . . . . . . . — 810,370
Common stock, par value $.20 per share, 1,125,000 shares authorized: 595,263 and
552,220 shares issued, respectively . . . . . . . . . . . . . . . . . . . . . . . . . . . . . . . . . . . . . 119,053 110,444
Additional paid-in capital . . . . . . . . . . . . . . . . . . . . . . . . . . . . . . . . . . . . . . . . . . . . . . 5,939,838 5,090,891
Accumulated other comprehensive loss (net of tax benefit of $25,758 and $23,448,
respectively) . . . . . . . . . . . . . . . . . . . . . . . . . . . . . . . . . . . . . . . . . . . . . . . . . . . . . (44,664) (40,825)
Retained earnings . . . . . . . . . . . . . . . . . . . . . . . . . . . . . . . . . . . . . . . . . . . . . . . . . . . 308,839 604,467
Total SLM Corporation stockholders’ equity before treasury stock . . . . . . . . . . . . . . . . . 6,888,066 7,140,347
Common stock held in treasury at cost: 68,320 and 67,222 shares, respectively . . . . . . . . 1,876,488 1,861,738
Total SLM Corporation stockholders’ equity. . . . . . . . . . . . . . . . . . . . . . . . . . . . . . . . . 5,011,578 5,278,609
Noncontrolling interest. . . . . . . . . . . . . . . . . . . . . . . . . . . . . . . . . . . . . . . . . . . . . . . . — 13
Total equity . . . . . . . . . . . . . . . . . . . . . . . . . . . . . . . . . . . . . . . . . . . . . . . . . . . . . . . 5,011,578 5,278,622
Total liabilities and equity . . . . . . . . . . . . . . . . . . . . . . . . . . . . . . . . . . . . . . . . . . . . . $205,307,049 $169,985,298
Supplemental information — assets and liabilities of consolidated variable interest entities:
December 31,
2010
December 31,
2009
FFELP Loans . . . . . . . . . . . . . . . . . . . . . . . . . . . . . . . . . . . . . . . . . . . . . . . . . . . . . . $145,750,016 $118,731,699
Private Education Loans. . . . . . . . . . . . . . . . . . . . . . . . . . . . . . . . . . . . . . . . . . . . . . . 24,355,683 10,107,298
Restricted cash and investments . . . . . . . . . . . . . . . . . . . . . . . . . . . . . . . . . . . . . . . . . 5,983,080 4,596,147
Other assets . . . . . . . . . . . . . . . . . . . . . . . . . . . . . . . . . . . . . . . . . . . . . . . . . . . . . . . 3,705,716 3,639,918
Short-term borrowings . . . . . . . . . . . . . . . . . . . . . . . . . . . . . . . . . . . . . . . . . . . . . . . . 24,484,353 23,384,051
Long-term borrowings . . . . . . . . . . . . . . . . . . . . . . . . . . . . . . . . . . . . . . . . . . . . . . . . 142,243,771 101,012,628
Net assets of consolidated variable interest entities . . . . . . . . . . . . . . . . . . . . . . . . . . . . $ 13,066,371 $ 12,678,383
See accompanying notes to consolidated financial statements.
F-4