Sallie Mae 2010 Annual Report Download - page 194
Download and view the complete annual report
Please find page 194 of the 2010 Sallie Mae annual report below. You can navigate through the pages in the report by either clicking on the pages listed below, or by using the keyword search tool below to find specific information within the annual report.-
 1
1 -
2
-
3
-
4
-
5
-
6
-
7
-
8
-
9
-
10
-
11
-
12
-
13
-
14
-
15
-
16
-
17
-
18
-
19
-
20
-
21
-
22
-
23
-
24
-
25
-
26
-
27
-
28
-
29
-
30
-
31
-
32
-
33
-
34
-
35
-
36
-
37
-
38
-
39
-
40
-
41
-
42
-
43
-
44
-
45
-
46
-
47
-
48
-
49
-
50
-
51
-
52
-
53
-
54
-
55
-
56
-
57
-
58
-
59
-
60
-
61
-
62
-
63
-
64
-
65
-
66
-
67
-
68
-
69
-
70
-
71
-
72
-
73
-
74
-
75
-
76
-
77
-
78
-
79
-
80
-
81
-
82
-
83
-
84
-
85
-
86
-
87
-
88
-
89
-
90
-
91
-
92
-
93
-
94
-
95
-
96
-
97
-
98
-
99
-
100
-
101
-
102
-
103
-
104
-
105
-
106
-
107
-
108
-
109
-
110
-
111
-
112
-
113
-
114
-
115
-
116
-
117
-
118
-
119
-
120
-
121
-
122
-
123
-
124
-
125
-
126
-
127
-
128
-
129
-
130
-
131
-
132
-
133
-
134
-
135
-
136
-
137
-
138
-
139
-
140
-
141
-
142
-
143
-
144
-
145
-
146
-
147
-
148
-
149
-
150
-
151
-
152
-
153
-
154
-
155
-
156
-
157
-
158
-
159
-
160
-
161
-
162
-
163
-
164
-
165
-
166
-
167
-
168
-
169
-
170
-
171
-
172
-
173
-
174
-
175
-
176
-
177
-
178
-
179
-
180
-
181
-
182
-
183
-
 184
184 -
 185
185 -
 186
186 -
 187
187 -
 188
188 -
 189
189 -
 190
190 -
 191
191 -
 192
192 -
 193
193 -
 194
194 -
 195
195 -
 196
196 -
 197
197 -
 198
198 -
 199
199 -
 200
200 -
 201
201 -
 202
202 -
 203
203 -
 204
204 -
205
-
206
-
207
-
208
-
209
-
210
-
211
-
212
-
213
-
214
-
215
-
216
-
217
-
218
-
219
-
220
-
221
-
222
-
223
-
224
-
225
-
226
 |
 |

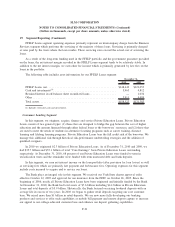
19. Segment Reporting (Continued)
FFELP Loans segment operating expenses primarily represent an intercompany charge from the Business
Services segment which performs the servicing of the majority of these loans. Servicing is primarily charged
at rates paid by the trusts where the loan resides. These servicing rates exceed the actual cost of servicing the
loans.
As a result of the long-term funding used in the FFELP portfolio and the government guarantee provided
on the loans, the net interest margin recorded in the FFELP Loans segment tends to be relatively stable. In
addition to the net interest margin, we earn other fee income which is primarily generated by late fees on the
loans in the portfolio.
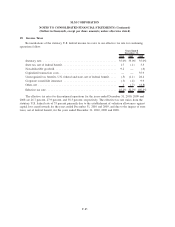
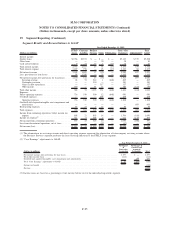
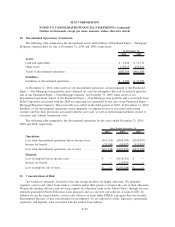
The following table includes asset information for our FFELP Loans segment.
2010 2009
December 31,
FFELP Loans, net ............................................ $148,649 $121,053
Cash and investments
(1)
........................................ 5,963 4,812
Retained Interest in off-balance sheet securitized loans................. — 1,034
Other ..................................................... 3,911 4,484
Total assets ................................................. $158,523 $131,383
(1) Includes restricted cash and investments.
Consumer Lending Segment
In this segment, we originate, acquire, finance and service Private Education Loans. Private Education
Loans consist of two general types: (1) those that are designed to bridge the gap between the cost of higher
education and the amount financed through either federal loans or the borrowers’ resources, and (2) those that
are used to meet the needs of students in alternative learning programs such as career training, distance
learning and lifelong learning programs. Private Education Loans bear the full credit risk of the borrower. We
manage this additional risk through historical risk-performance underwriting strategies and the addition of
qualified cosigners.
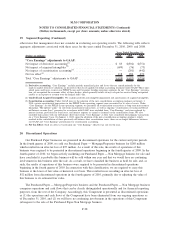
In 2010 we originated $2.3 billion of Private Education Loans. As of December 31, 2010 and 2009, we
had $35.7 billion and $35.1 billion of total “Core Earnings” basis Private Education Loans outstanding,
respectively. At December 31, 2010, 68 percent of our Private Education Loans were funded to term in
securitization trusts and the remainder were funded with term unsecured debt and bank deposits.
In this segment, we earn net interest income on the loan portfolio (after provision for loan losses) as well
as servicing fees which are primarily late payment and forbearance fees. Operating expenses for this segment
include costs incurred to acquire and to service our loans.
The Bank plays an integral role in this segment. We received our Utah State charter approval order
effective October 12, 2005 and approval for our insurance from the FDIC on October 26, 2005. Since the
beginning of 2006, nearly all Private Education Loans have been originated and initially funded by the Bank.
At December 31, 2010, the Bank had total assets of $7.6 billion including $4.4 billion in Private Education
Loans and total deposits of $5.9 billion. Historically, the Bank focused on raising brokered deposits with an
average life in excess of two years. In 2010 we began to gather retail deposits targeting our core customer
base. We raised more than $1 billion in retail deposits. We are now more fully developing our banking
products and services to offer such capabilities as mobile bill payment and remote deposit capture to increase
our appeal to our college-educated customer base and enhance our deposit gathering capabilities.
F-91
SLM CORPORATION
NOTES TO CONSOLIDATED FINANCIAL STATEMENTS (Continued)
(Dollars in thousands, except per share amounts, unless otherwise stated)