Sallie Mae 2010 Annual Report Download - page 161
Download and view the complete annual report
Please find page 161 of the 2010 Sallie Mae annual report below. You can navigate through the pages in the report by either clicking on the pages listed below, or by using the keyword search tool below to find specific information within the annual report.-
 1
1 -
2
-
3
-
4
-
5
-
6
-
7
-
8
-
9
-
10
-
11
-
12
-
13
-
14
-
15
-
16
-
17
-
18
-
19
-
20
-
21
-
22
-
23
-
24
-
25
-
26
-
27
-
28
-
29
-
30
-
31
-
32
-
33
-
34
-
35
-
36
-
37
-
38
-
39
-
40
-
41
-
42
-
43
-
44
-
45
-
46
-
47
-
48
-
49
-
50
-
51
-
52
-
53
-
54
-
55
-
56
-
57
-
58
-
59
-
60
-
61
-
62
-
63
-
64
-
65
-
66
-
67
-
68
-
69
-
70
-
71
-
72
-
73
-
74
-
75
-
76
-
77
-
78
-
79
-
80
-
81
-
82
-
83
-
84
-
85
-
86
-
87
-
88
-
89
-
90
-
91
-
92
-
93
-
94
-
95
-
96
-
97
-
98
-
99
-
100
-
101
-
102
-
103
-
104
-
105
-
106
-
107
-
108
-
109
-
110
-
111
-
112
-
113
-
114
-
115
-
116
-
117
-
118
-
119
-
120
-
121
-
122
-
123
-
124
-
125
-
126
-
127
-
128
-
129
-
130
-
131
-
132
-
133
-
134
-
135
-
136
-
137
-
138
-
139
-
140
-
141
-
142
-
143
-
144
-
145
-
146
-
147
-
148
-
149
-
150
-
 151
151 -
 152
152 -
 153
153 -
 154
154 -
 155
155 -
 156
156 -
 157
157 -
 158
158 -
 159
159 -
 160
160 -
 161
161 -
 162
162 -
 163
163 -
 164
164 -
 165
165 -
 166
166 -
 167
167 -
 168
168 -
 169
169 -
 170
170 -
 171
171 -
172
-
173
-
174
-
175
-
176
-
177
-
178
-
179
-
180
-
181
-
182
-
183
-
184
-
185
-
186
-
187
-
188
-
189
-
190
-
191
-
192
-
193
-
194
-
195
-
196
-
197
-
198
-
199
-
200
-
201
-
202
-
203
-
204
-
205
-
206
-
207
-
208
-
209
-
210
-
211
-
212
-
213
-
214
-
215
-
216
-
217
-
218
-
219
-
220
-
221
-
222
-
223
-
224
-
225
-
226
 |
 |

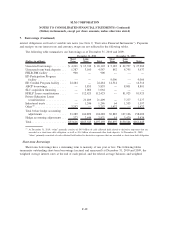
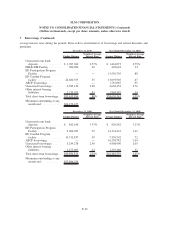
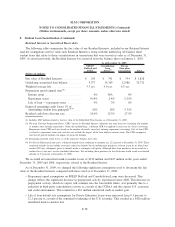
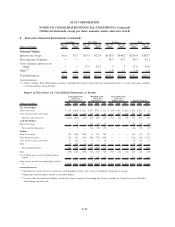
8. Student Loan Securitization (Continued)
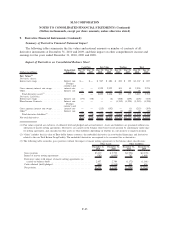
Retained Interest in Securitized Receivables
The following tables summarize the fair value of our Residual Interests, included in our Retained Interest
(and the assumptions used to value such Residual Interests), along with the underlying off-balance sheet
student loans that relate to those securitizations in transactions that were treated as sales as of December 31,
2009. As noted previously, the Residual Interest was removed from the balance sheet on January 1, 2010.
FFELP
Stafford and
PLUS
Consolidation
Loan
Trusts
(1)
Private
Education
Loan Trusts Total
As of December 31, 2009
(Dollars in millions)
Fair value of Residual Interests ............ $ 243 $ 791 $ 794 $ 1,828
Underlying securitized loan balance ......... 5,377 14,369 12,986 32,732
Weighted average life ................... 3.3yrs. 9.0 yrs. 6.3 yrs.
Prepayment speed (annual rate)
(2)
:
Interim status ....................... 0% N/A 0%
Repayment status .................... 0-14% 2-4% 2-15%
Life of loan — repayment status ......... 9% 3% 6%
Expected remaining credit losses (% of
outstanding student loan principal)
(3)(4)
..... .10% .25% 5.31%
Residual cash flows discount rate .......... 10.6% 12.3% 27.5%
(1) Includes $569 million related to the fair value of the Embedded Floor Income as of December 31, 2009.
(2) We used Constant Prepayment Rate (“CPR”) curves for Residual Interest valuations that were based on seasoning (the number
of months since entering repayment). Under this methodology, a different CPR was applied to each year of a loan’s seasoning.
Repayment status CPR used was based on the number of months since first entering repayment (seasoning). Life of loan CPR
is related to repayment status only and does not include the impact of the loan while in interim status. The CPR assumption
used for all periods includes the impact of projected defaults.
(3) Remaining expected credit losses as of the respective balance sheet date.
(4) For Private Education Loan trusts, estimated defaults from settlement to maturity are 12.2 percent at December 31, 2009. These
estimated defaults do not include recoveries related to defaults but do include prior purchases of loans at par by us when loans
reached 180 days delinquent (prior to default) under a contingent call option. Although these loan purchases do not result in a
realized loss to the trust, we have included them here. Not including these purchases in the disclosure would result in estimated
defaults of 9.3 percent at December 31, 2009.
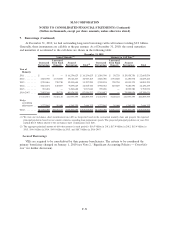
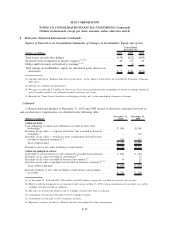
We recorded net unrealized mark-to-market losses of $330 million and $425 million in the years ended
December 31, 2009 and 2008, respectively, related to the Residual Interest.
As of December 31, 2009, we changed the following significant assumptions used to determine the fair
value of the Residual Interests compared with those used as of December 31, 2008:
• Prepayment speed assumptions on FFELP Stafford and Consolidation Loans were decreased. This
change reflects the significant decrease in prepayment activity experienced since 2008. This decrease in
prepayment activity, which we expect will continue into the foreseeable future, was primarily due to a
reduction in third-party consolidation activity as a result of the CCRAA and the current U.S. economic
and credit environment. This resulted in a $61 million unrealized mark-to-market gain.
• Life of loan default rate assumptions for Private Education Loans were increased from 9.1 percent to
12.2 percent as a result of the continued weakening of the U.S. economy. This resulted in a $426 million
unrealized mark-to-market loss.
F-58
SLM CORPORATION
NOTES TO CONSOLIDATED FINANCIAL STATEMENTS (Continued)
(Dollars in thousands, except per share amounts, unless otherwise stated)