Sallie Mae 2010 Annual Report Download - page 77
Download and view the complete annual report
Please find page 77 of the 2010 Sallie Mae annual report below. You can navigate through the pages in the report by either clicking on the pages listed below, or by using the keyword search tool below to find specific information within the annual report.-
 1
1 -
2
-
3
-
4
-
5
-
6
-
7
-
8
-
9
-
10
-
11
-
12
-
13
-
14
-
15
-
16
-
17
-
18
-
19
-
20
-
21
-
22
-
23
-
24
-
25
-
26
-
27
-
28
-
29
-
30
-
31
-
32
-
33
-
34
-
35
-
36
-
37
-
38
-
39
-
40
-
41
-
42
-
43
-
44
-
45
-
46
-
47
-
48
-
49
-
50
-
51
-
52
-
53
-
54
-
55
-
56
-
57
-
58
-
59
-
60
-
61
-
62
-
63
-
64
-
65
-
66
-
 67
67 -
 68
68 -
 69
69 -
 70
70 -
 71
71 -
 72
72 -
 73
73 -
 74
74 -
 75
75 -
 76
76 -
 77
77 -
 78
78 -
 79
79 -
 80
80 -
 81
81 -
 82
82 -
 83
83 -
 84
84 -
 85
85 -
 86
86 -
 87
87 -
88
-
89
-
90
-
91
-
92
-
93
-
94
-
95
-
96
-
97
-
98
-
99
-
100
-
101
-
102
-
103
-
104
-
105
-
106
-
107
-
108
-
109
-
110
-
111
-
112
-
113
-
114
-
115
-
116
-
117
-
118
-
119
-
120
-
121
-
122
-
123
-
124
-
125
-
126
-
127
-
128
-
129
-
130
-
131
-
132
-
133
-
134
-
135
-
136
-
137
-
138
-
139
-
140
-
141
-
142
-
143
-
144
-
145
-
146
-
147
-
148
-
149
-
150
-
151
-
152
-
153
-
154
-
155
-
156
-
157
-
158
-
159
-
160
-
161
-
162
-
163
-
164
-
165
-
166
-
167
-
168
-
169
-
170
-
171
-
172
-
173
-
174
-
175
-
176
-
177
-
178
-
179
-
180
-
181
-
182
-
183
-
184
-
185
-
186
-
187
-
188
-
189
-
190
-
191
-
192
-
193
-
194
-
195
-
196
-
197
-
198
-
199
-
200
-
201
-
202
-
203
-
204
-
205
-
206
-
207
-
208
-
209
-
210
-
211
-
212
-
213
-
214
-
215
-
216
-
217
-
218
-
219
-
220
-
221
-
222
-
223
-
224
-
225
-
226
 |
 |

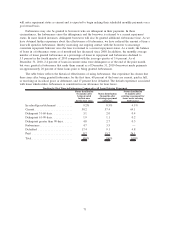
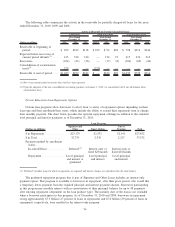
We continued to use ED’s Purchase and Participation Programs to fund FFELP Stafford and PLUS Loans
disbursed through September 30, 2010 (see Item 1 “Business — Recent Legislation” for a further discussion
regarding the end of new FFELP Loan originations as of July 1, 2010).
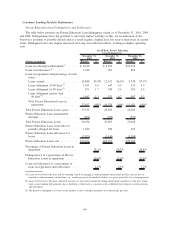
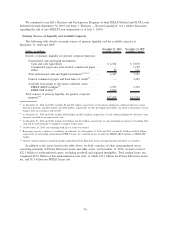
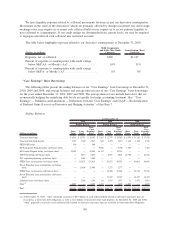
Primary Sources of Liquidity and Available Capacity
The following table details our main sources of primary liquidity and the available capacity at
December 31, 2010 and 2009.
(Dollars in millions)
December 31, 2010
Available Capacity
December 31, 2009
Available Capacity
Sources of primary liquidity for general corporate purposes:
Unrestricted cash and liquid investments:
Cash and cash equivalents . . ...................... $ 4,342 $ 6,070
Commercial paper and asset-backed commercial paper . . . — 1,150
Other ....................................... 85 131
Total unrestricted cash and liquid investments
(1)(2)(3)
...... 4,427 7,351
Unused commercial paper and bank lines of credit
(4)
...... — 3,485
Available borrowings to the extent collateral exists:
FFELP ABCP facilities
(5)
......................... 3,937 1,703
FHLB-DM facility
(5)
............................ 8,664 —
Total sources of primary liquidity for general corporate
purposes
(6)
..................................... $17,028 $12,539
(1)
At December 31, 2010 and 2009, excludes $0 and $25 million, respectively, of investments pledged as collateral related to certain
derivative positions and $872 million and $708 million, respectively, of other non-liquid investments, classified as investments on our
balance sheet in accordance with GAAP.
(2)
At December 31, 2010 and 2009, includes $684 million and $821 million, respectively, of cash collateral pledged by derivative coun-
terparties and held in our unrestricted cash.
(3)
At December 31, 2010 and 2009, includes $2.0 billion and $2.4 billion, respectively, of cash and liquid investments at the Bank. This
cash will be used primarily to originate or acquire student loans.
(4)
On November 24, 2010, our remaining bank line of credit was retired.
(5)
Borrowing capacity is subject to availability of collateral. As of December 31, 2010 and 2009, we had $1.5 billion and $2.1 billion,
respectively, of outstanding unencumbered FFELP Loans, net, available for use in either the FFELP ABCP facilities or FHLB-DM
facility.
(6)
General corporate purposes primarily include originating Private Education Loans and repaying unsecured debt as it matures.
In addition to the assets listed in the table above, we hold a number of other unencumbered assets,
consisting primarily of Private Education Loans and other assets. At December 31, 2010, we had a total of
$22.3 billion of unencumbered assets, excluding goodwill and acquired intangibles. Total student loans, net,
comprised $12.6 billion of this unencumbered asset total, of which $11.1 billion are Private Education Loans,
net, and $1.5 billion are FFELP Loans, net.
76