Sallie Mae 2010 Annual Report Download - page 108
Download and view the complete annual report
Please find page 108 of the 2010 Sallie Mae annual report below. You can navigate through the pages in the report by either clicking on the pages listed below, or by using the keyword search tool below to find specific information within the annual report.-
 1
1 -
2
-
3
-
4
-
5
-
6
-
7
-
8
-
9
-
10
-
11
-
12
-
13
-
14
-
15
-
16
-
17
-
18
-
19
-
20
-
21
-
22
-
23
-
24
-
25
-
26
-
27
-
28
-
29
-
30
-
31
-
32
-
33
-
34
-
35
-
36
-
37
-
38
-
39
-
40
-
41
-
42
-
43
-
44
-
45
-
46
-
47
-
48
-
49
-
50
-
51
-
52
-
53
-
54
-
55
-
56
-
57
-
58
-
59
-
60
-
61
-
62
-
63
-
64
-
65
-
66
-
67
-
68
-
69
-
70
-
71
-
72
-
73
-
74
-
75
-
76
-
77
-
78
-
79
-
80
-
81
-
82
-
83
-
84
-
85
-
86
-
87
-
88
-
89
-
90
-
91
-
92
-
93
-
94
-
95
-
96
-
97
-
 98
98 -
 99
99 -
 100
100 -
 101
101 -
 102
102 -
 103
103 -
 104
104 -
 105
105 -
 106
106 -
 107
107 -
 108
108 -
 109
109 -
 110
110 -
 111
111 -
 112
112 -
 113
113 -
 114
114 -
 115
115 -
 116
116 -
 117
117 -
 118
118 -
119
-
120
-
121
-
122
-
123
-
124
-
125
-
126
-
127
-
128
-
129
-
130
-
131
-
132
-
133
-
134
-
135
-
136
-
137
-
138
-
139
-
140
-
141
-
142
-
143
-
144
-
145
-
146
-
147
-
148
-
149
-
150
-
151
-
152
-
153
-
154
-
155
-
156
-
157
-
158
-
159
-
160
-
161
-
162
-
163
-
164
-
165
-
166
-
167
-
168
-
169
-
170
-
171
-
172
-
173
-
174
-
175
-
176
-
177
-
178
-
179
-
180
-
181
-
182
-
183
-
184
-
185
-
186
-
187
-
188
-
189
-
190
-
191
-
192
-
193
-
194
-
195
-
196
-
197
-
198
-
199
-
200
-
201
-
202
-
203
-
204
-
205
-
206
-
207
-
208
-
209
-
210
-
211
-
212
-
213
-
214
-
215
-
216
-
217
-
218
-
219
-
220
-
221
-
222
-
223
-
224
-
225
-
226
 |
 |

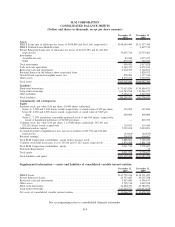
SLM CORPORATION
CONSOLIDATED STATEMENTS OF INCOME
(In thousands, except per share amounts)
2010 2009 2008
Years Ended December 31,
Interest income:
FFELP Loans ......................................... $3,345,175 $3,093,782 $5,173,086
Private Education Loans ................................. 2,353,134 1,582,514 1,737,554
Other loans .......................................... 29,707 56,005 82,734
Cash and investments ................................... 25,899 26,064 276,264
Total interest income ..................................... 5,753,915 4,758,365 7,269,638
Total interest expense ..................................... 2,274,771 3,035,639 5,905,418
Net interest income ...................................... 3,479,144 1,722,726 1,364,220
Less: provisions for loan losses.............................. 1,419,413 1,118,960 719,650
Net interest income after provisions for loan losses ............... 2,059,731 603,766 644,570
Other income (loss):
Securitization servicing and Residual Interest revenue ........... — 295,297 261,819
Gains (losses) on sales of loans and securities, net .............. 324,780 283,836 (186,155)
Losses on derivative and hedging activities, net ................ (360,999) (604,535) (445,413)
Servicing revenue ...................................... 404,927 440,098 407,575
Contingency revenue ................................... 330,390 294,177 329,745
Gains on debt repurchases ............................... 316,941 536,190 64,477
Other ............................................... 6,369 88,016 39,979
Total other income ....................................... 1,022,408 1,333,079 472,027
Expenses:
Salaries and benefits .................................... 561,128 539,423 570,430
Other operating expenses ................................ 646,574 503,013 459,047
Total operating expenses ................................. 1,207,702 1,042,436 1,029,477
Goodwill and acquired intangible assets impairment and
amortization expense.................................. 698,902 75,960 49,674
Restructuring expenses .................................. 85,236 10,571 71,659
Total expenses .......................................... 1,991,840 1,128,967 1,150,810
Income (loss) from continuing operations, before income tax expense
(benefit) ............................................. 1,090,299 807,878 (34,213)
Income tax expense (benefit) ............................... 492,769 263,868 (36,693)
Net income from continuing operations ........................ 597,530 544,010 2,480
Loss from discontinued operations, net of tax benefit ............. (67,148) (219,872) (215,106)
Net income (loss) ....................................... 530,382 324,138 (212,626)
Preferred stock dividends .................................. 72,143 145,836 111,206
Net income (loss) attributable to SLM Corporation common stock .... $ 458,239 $ 178,302 $ (323,832)
Basic earnings (loss) per common share:
Continuing operations .................................... $ 1.08 $ .85 $ (.23)
Discontinued operations ................................... $ (.14) $ (.47) $ (.46)
Total ................................................. $ .94 $ .38 $ (.69)
Average common shares outstanding . . ........................ 486,673 470,858 466,642
Diluted earnings (loss) per common share:
Continuing operations .................................... $ 1.08 $ .85 $ (.23)
Discontinued operations ................................... $ (.14) $ (.47) $ (.46)
Total ................................................. $ .94 $ .38 $ (.69)
Average common and common equivalent shares outstanding ....... 488,485 471,584 466,642
Dividends per common share ............................... $ — $ — $ —
See accompanying notes to consolidated financial statements.
F-5