Sallie Mae 2010 Annual Report Download - page 90
Download and view the complete annual report
Please find page 90 of the 2010 Sallie Mae annual report below. You can navigate through the pages in the report by either clicking on the pages listed below, or by using the keyword search tool below to find specific information within the annual report.-
 1
1 -
2
-
3
-
4
-
5
-
6
-
7
-
8
-
9
-
10
-
11
-
12
-
13
-
14
-
15
-
16
-
17
-
18
-
19
-
20
-
21
-
22
-
23
-
24
-
25
-
26
-
27
-
28
-
29
-
30
-
31
-
32
-
33
-
34
-
35
-
36
-
37
-
38
-
39
-
40
-
41
-
42
-
43
-
44
-
45
-
46
-
47
-
48
-
49
-
50
-
51
-
52
-
53
-
54
-
55
-
56
-
57
-
58
-
59
-
60
-
61
-
62
-
63
-
64
-
65
-
66
-
67
-
68
-
69
-
70
-
71
-
72
-
73
-
74
-
75
-
76
-
77
-
78
-
79
-
 80
80 -
 81
81 -
 82
82 -
 83
83 -
 84
84 -
 85
85 -
 86
86 -
 87
87 -
 88
88 -
 89
89 -
 90
90 -
 91
91 -
 92
92 -
 93
93 -
 94
94 -
 95
95 -
 96
96 -
 97
97 -
 98
98 -
 99
99 -
 100
100 -
101
-
102
-
103
-
104
-
105
-
106
-
107
-
108
-
109
-
110
-
111
-
112
-
113
-
114
-
115
-
116
-
117
-
118
-
119
-
120
-
121
-
122
-
123
-
124
-
125
-
126
-
127
-
128
-
129
-
130
-
131
-
132
-
133
-
134
-
135
-
136
-
137
-
138
-
139
-
140
-
141
-
142
-
143
-
144
-
145
-
146
-
147
-
148
-
149
-
150
-
151
-
152
-
153
-
154
-
155
-
156
-
157
-
158
-
159
-
160
-
161
-
162
-
163
-
164
-
165
-
166
-
167
-
168
-
169
-
170
-
171
-
172
-
173
-
174
-
175
-
176
-
177
-
178
-
179
-
180
-
181
-
182
-
183
-
184
-
185
-
186
-
187
-
188
-
189
-
190
-
191
-
192
-
193
-
194
-
195
-
196
-
197
-
198
-
199
-
200
-
201
-
202
-
203
-
204
-
205
-
206
-
207
-
208
-
209
-
210
-
211
-
212
-
213
-
214
-
215
-
216
-
217
-
218
-
219
-
220
-
221
-
222
-
223
-
224
-
225
-
226
 |
 |

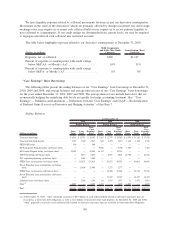
Common Stock
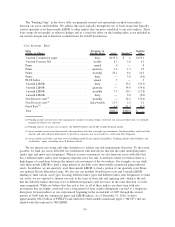
The following table summarizes our common share repurchases and issuances for the years ended
December 31, 2010, 2009 and 2008.
(Shares in millions) 2010 2009 2008
Years Ended December 31,
Common shares repurchased:
Open market .......................................... — — —
Benefit plans
(1)
........................................ 1.1 .3 1.0
Total shares repurchased ................................. 1.1 .3 1.0
Average purchase price per share ........................... $13.44 $20.29 $24.51
Common shares issued .................................... 1.8 17.8 1.9
Authority remaining at end of period for repurchases .............. 38.8 38.8 38.8
(1) Shares withheld from stock option exercises and vesting of restricted stock for employees’ tax withholding obligations and shares
tendered by employees to satisfy option exercise costs.
During 2009, we converted $339 million of our Series C Preferred Stock to common stock. As part of
this conversion, we delivered to the holders of the preferred stock: (1) approximately 17 million shares (the
number of common shares they would most likely receive if the preferred stock they held mandatorily
converted to common shares in the fourth quarter of 2010) plus (2) a discounted amount of the preferred stock
dividends the holders of the preferred stock would have received if they held the preferred stock through the
mandatory conversion date. The accounting treatment for this conversion resulted in additional dividends
recorded as part of preferred stock dividends for the year of approximately $53 million.
On December 15, 2010, the mandatory conversion date, the remaining 810,370 shares of our Series C
Preferred Stock were converted into 41 million shares of common stock.
The closing price of our common stock on December 31, 2010 was $12.59
89