Sallie Mae 2010 Annual Report Download - page 131
Download and view the complete annual report
Please find page 131 of the 2010 Sallie Mae annual report below. You can navigate through the pages in the report by either clicking on the pages listed below, or by using the keyword search tool below to find specific information within the annual report.-
 1
1 -
2
-
3
-
4
-
5
-
6
-
7
-
8
-
9
-
10
-
11
-
12
-
13
-
14
-
15
-
16
-
17
-
18
-
19
-
20
-
21
-
22
-
23
-
24
-
25
-
26
-
27
-
28
-
29
-
30
-
31
-
32
-
33
-
34
-
35
-
36
-
37
-
38
-
39
-
40
-
41
-
42
-
43
-
44
-
45
-
46
-
47
-
48
-
49
-
50
-
51
-
52
-
53
-
54
-
55
-
56
-
57
-
58
-
59
-
60
-
61
-
62
-
63
-
64
-
65
-
66
-
67
-
68
-
69
-
70
-
71
-
72
-
73
-
74
-
75
-
76
-
77
-
78
-
79
-
80
-
81
-
82
-
83
-
84
-
85
-
86
-
87
-
88
-
89
-
90
-
91
-
92
-
93
-
94
-
95
-
96
-
97
-
98
-
99
-
100
-
101
-
102
-
103
-
104
-
105
-
106
-
107
-
108
-
109
-
110
-
111
-
112
-
113
-
114
-
115
-
116
-
117
-
118
-
119
-
120
-
 121
121 -
 122
122 -
 123
123 -
 124
124 -
 125
125 -
 126
126 -
 127
127 -
 128
128 -
 129
129 -
 130
130 -
 131
131 -
 132
132 -
 133
133 -
 134
134 -
 135
135 -
 136
136 -
 137
137 -
 138
138 -
 139
139 -
 140
140 -
 141
141 -
142
-
143
-
144
-
145
-
146
-
147
-
148
-
149
-
150
-
151
-
152
-
153
-
154
-
155
-
156
-
157
-
158
-
159
-
160
-
161
-
162
-
163
-
164
-
165
-
166
-
167
-
168
-
169
-
170
-
171
-
172
-
173
-
174
-
175
-
176
-
177
-
178
-
179
-
180
-
181
-
182
-
183
-
184
-
185
-
186
-
187
-
188
-
189
-
190
-
191
-
192
-
193
-
194
-
195
-
196
-
197
-
198
-
199
-
200
-
201
-
202
-
203
-
204
-
205
-
206
-
207
-
208
-
209
-
210
-
211
-
212
-
213
-
214
-
215
-
216
-
217
-
218
-
219
-
220
-
221
-
222
-
223
-
224
-
225
-
226
 |
 |

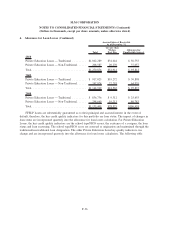
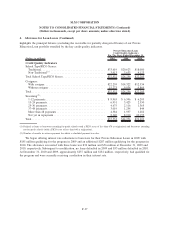
3. Student Loans (Continued)
borrower’s loan is placed into a forbearance status in limited monthly increments and is reflected in the
forbearance status at month-end during this time. At the end of their granted forbearance period, the borrower
will enter repayment status as current and is expected to begin making their scheduled monthly payments on a
go-forward basis.
Forbearance may also be granted to borrowers who are delinquent in their payments. In these
circumstances, the forbearance cures the delinquency and the borrower is returned to a current repayment
status. In more limited instances, delinquent borrowers will also be granted additional forbearance time. As we
have obtained further experience about the effectiveness of forbearance, we have reduced the amount of time
a loan will spend in forbearance, thereby increasing our ongoing contact with the borrower to encourage
consistent repayment behavior once the loan is returned to a current repayment status.
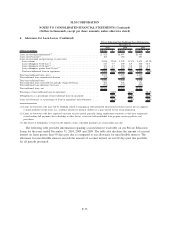
During 2009, we instituted an interest rate reduction program to assist customers in repaying their Private
Education Loans through reduced payments, while continuing to reduce their outstanding principal balance.
This program is offered in situations where the potential for principal recovery, through a modification of the
monthly payment amount, is better than other alternatives currently available. Along with the ability and
willingness to pay, the customer must make three consecutive monthly payments at the reduced rate to qualify
for the program. Once the customer has made the initial three payments, the loans status is returned to current
and the interest rate is reduced for the successive twelve month period.
We may charge the borrower fees on certain Private Education Loans, either at origination, when the loan
enters repayment, or both. Such fees are deferred and recognized into income as a component of interest over
the estimated average life of the related pool of loans.
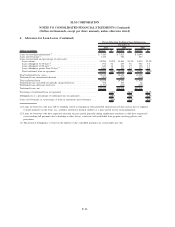
As of December 31, 2010 and 2009, 68 percent and 59 percent, respectively, of our on-balance sheet
student loan portfolio was in repayment.
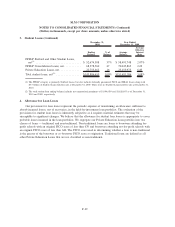
The estimated weighted average life of student loans in our portfolio was approximately 7.7 years and
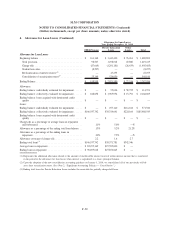
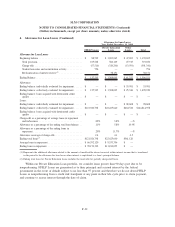
7.9 years at December 31, 2010 and 2009, respectively. The following table reflects the distribution of our
student loan portfolio by program.
Ending
Balance
%of
Balance
Average
Balance
Average
Effective
Interest
Rate
December 31,
2010
Year Ended
December 31, 2010
FFELP Stafford and Other Student Loans,
net
(1)
............................. $ 56,252,860 31% $ 61,034,317 1.93%
FFELP Consolidation Loans, net ........... 92,396,540 50 81,008,682 2.67
Private Education Loans, net .............. 35,655,724 19 36,534,158 6.44
Total student loans, net
(2)
................ $184,305,124 100% $178,577,157 3.19%
F-28
SLM CORPORATION
NOTES TO CONSOLIDATED FINANCIAL STATEMENTS (Continued)
(Dollars in thousands, except per share amounts, unless otherwise stated)