Sallie Mae 2010 Annual Report Download - page 172
Download and view the complete annual report
Please find page 172 of the 2010 Sallie Mae annual report below. You can navigate through the pages in the report by either clicking on the pages listed below, or by using the keyword search tool below to find specific information within the annual report.
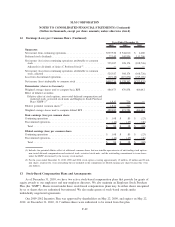
12. Earnings (Loss) per Common Share (Continued)
2010 2009 2008
Years Ended December 31,
Numerator:
Net income from continuing operations . . . . . . . . . . . . . . . . . . . . . . . . . $597,530 $ 544,010 $ 2,480
Preferred stock dividends . . . . . . . . . . . . . . . . . . . . . . . . . . . . . . . . . . . 72,143 145,836 111,206
Net income (loss) from continuing operations attributable to common
stock . . . . . . . . . . . . . . . . . . . . . . . . . . . . . . . . . . . . . . . . . . . . . . . 525,387 398,174 (108,726)
Adjusted for dividends of Series C Preferred Stock
(1)
.............. — — —
Net income (loss) from continuing operations attributable to common
stock, adjusted . . . . . . . . . . . . . . . . . . . . . . . . . . . . . . . . . . . . . . . . 525,387 398,174 (108,726)
Loss from discontinued operations . . . . . . . . . . . . . . . . . . . . . . . . . . . . (67,148) (219,872) (215,106)
Net income (loss) attributable to common stock . . . . . . . . . . . . . . . . . . . $458,239 $ 178,302 $(323,832)
Denominator (shares in thousands):
Weighted average shares used to compute basic EPS. . . . . . . . . . . . . . . . 486,673 470,858 466,642
Effect of dilutive securities:
Dilutive effect of stock options, non-vested deferred compensation and
restricted stock, restricted stock units and Employee Stock Purchase
Plan (“ESPP”)
(1)
..................................... 1,812 726 —
Dilutive potential common shares
(2)
........................... 1,812 726 —
Weighted average shares used to compute diluted EPS . . . . . . . . . . . . . . 488,485 471,584 466,642
Basic earnings (loss) per common share:
Continuing operations . . . . . . . . . . . . . . . . . . . . . . . . . . . . . . . . . . . . . $ 1.08 $ .85 $ (.23)
Discontinued operations . . . . . . . . . . . . . . . . . . . . . . . . . . . . . . . . . . . . (.14) (.47) (.46)
Total . . . . . . . . . . . . . . . . . . . . . . . . . . . . . . . . . . . . . . . . . . . . . . . $ .94 $ .38 $ (.69)
Diluted earnings (loss) per common share:
Continuing operations . . . . . . . . . . . . . . . . . . . . . . . . . . . . . . . . . . . . . $ 1.08 $ .85 $ (.23)
Discontinued operations . . . . . . . . . . . . . . . . . . . . . . . . . . . . . . . . . . . . (.14) (.47) (.46)
Total . . . . . . . . . . . . . . . . . . . . . . . . . . . . . . . . . . . . . . . . . . . . . . . $ .94 $ .38 $ (.69)
(1) Includes the potential dilutive effect of additional common shares that are issuable upon exercise of outstanding stock options,
non-vested deferred compensation and restricted stock, restricted stock units, and the outstanding commitment to issue shares
under the ESPP, determined by the treasury stock method.
(2) For the years ended December 31, 2010, 2009 and 2008, stock options covering approximately 15 million, 42 million and 38 mil-
lion shares, respectively, were outstanding but not included in the computation of diluted earnings per share because they were
anti-dilutive.
13. Stock-Based Compensation Plans and Arrangements
As of December 31, 2010, we have two active stock-based compensation plans that provide for grants of
equity awards to our employees and non-employee directors. We also maintain an Employee Stock Purchase
Plan (the “ESPP”). Shares issued under these stock-based compensation plans may be either shares reacquired
by us or shares that are authorized but unissued. We also make grants of stock-based awards under
individually negotiated agreements.
Our 2009-2012 Incentive Plan was approved by shareholders on May 22, 2009, and expires on May 22,
2012. At December 31, 2010, 21.7 million shares were authorized to be issued from this plan.
F-69
SLM CORPORATION
NOTES TO CONSOLIDATED FINANCIAL STATEMENTS (Continued)
(Dollars in thousands, except per share amounts, unless otherwise stated)


