Sallie Mae 2010 Annual Report Download - page 34
Download and view the complete annual report
Please find page 34 of the 2010 Sallie Mae annual report below. You can navigate through the pages in the report by either clicking on the pages listed below, or by using the keyword search tool below to find specific information within the annual report.-
 1
1 -
2
-
3
-
4
-
5
-
6
-
7
-
8
-
9
-
10
-
11
-
12
-
13
-
14
-
15
-
16
-
17
-
18
-
19
-
20
-
21
-
22
-
23
-
 24
24 -
 25
25 -
 26
26 -
 27
27 -
 28
28 -
 29
29 -
 30
30 -
 31
31 -
 32
32 -
 33
33 -
 34
34 -
 35
35 -
 36
36 -
 37
37 -
 38
38 -
 39
39 -
 40
40 -
 41
41 -
 42
42 -
 43
43 -
 44
44 -
45
-
46
-
47
-
48
-
49
-
50
-
51
-
52
-
53
-
54
-
55
-
56
-
57
-
58
-
59
-
60
-
61
-
62
-
63
-
64
-
65
-
66
-
67
-
68
-
69
-
70
-
71
-
72
-
73
-
74
-
75
-
76
-
77
-
78
-
79
-
80
-
81
-
82
-
83
-
84
-
85
-
86
-
87
-
88
-
89
-
90
-
91
-
92
-
93
-
94
-
95
-
96
-
97
-
98
-
99
-
100
-
101
-
102
-
103
-
104
-
105
-
106
-
107
-
108
-
109
-
110
-
111
-
112
-
113
-
114
-
115
-
116
-
117
-
118
-
119
-
120
-
121
-
122
-
123
-
124
-
125
-
126
-
127
-
128
-
129
-
130
-
131
-
132
-
133
-
134
-
135
-
136
-
137
-
138
-
139
-
140
-
141
-
142
-
143
-
144
-
145
-
146
-
147
-
148
-
149
-
150
-
151
-
152
-
153
-
154
-
155
-
156
-
157
-
158
-
159
-
160
-
161
-
162
-
163
-
164
-
165
-
166
-
167
-
168
-
169
-
170
-
171
-
172
-
173
-
174
-
175
-
176
-
177
-
178
-
179
-
180
-
181
-
182
-
183
-
184
-
185
-
186
-
187
-
188
-
189
-
190
-
191
-
192
-
193
-
194
-
195
-
196
-
197
-
198
-
199
-
200
-
201
-
202
-
203
-
204
-
205
-
206
-
207
-
208
-
209
-
210
-
211
-
212
-
213
-
214
-
215
-
216
-
217
-
218
-
219
-
220
-
221
-
222
-
223
-
224
-
225
-
226
 |
 |
• Income tax expense from continuing operations increased $229 million for the year ended December 31,
2010 as compared with the prior year. The effective tax rates for fiscal years 2010 and 2009 were
45 percent and 33 percent, respectively. The change in the effective tax rate for the year ended
December 31, 2010 was primarily driven by the impact of non-deductible goodwill impairments
recorded in 2010 and state tax rate changes recorded in both periods.
Net Loss from Discontinued Operations.
Net loss from discontinued operations in the year ended December 31, 2010 was $67 million compared with
a net loss from discontinued operations of $220 million for the year ended December 31, 2009. In the fourth
quarter of 2009, we sold our Purchased Paper — Mortgage/Properties business for $280 million which resulted
in an after-tax loss of $95 million. As a result of this sale, the results of operations of this business were
presented in discontinued operations in the fourth quarter of 2009. In the fourth quarter of 2010, we began
actively marketing our Purchased Paper — Non Mortgage business for sale and have concluded it is probable
this business will be sold within one year at which time we would exit the business. As a result, the results of
operations of this business were also required to be presented in discontinued operations beginning in the
fourth quarter of 2010. In connection with this presentation, we are required to carry this business at the lower
of fair value or historical cost basis. As a result, we recorded an after-tax loss of $52 million from
discontinued operations in the fourth quarter of 2010, primarily due to adjusting the value of this business to
its estimated fair value. Our Purchased Paper businesses are presented in discontinued operations for the
current and prior periods. The additional losses for both years that are more than the losses discussed above
relate to ongoing impairment recorded as a result of the weakened economy’s effect on our ability to collect
the receivables.
Year Ended December 31, 2009 Compared with Year Ended December 31, 2008
For the years ended December 31, 2009 and 2008, net income was $324 million, or $.38 diluted earnings
per common share, and a net loss of $213 million, or $.69 diluted loss per common share, respectively. For
the years ended December 31, 2009 and 2008, net income from continuing operations was $544 million, or
$.85 diluted earnings per common share, and $2 million, or $.23 diluted loss per common share, respectively.
For the years ended December 31, 2009 and 2008, net loss from discontinued operations was $220 million, or
$.47 diluted loss per common share, and $215 million, or $.46 diluted loss from discontinued operations per
common share, respectively.
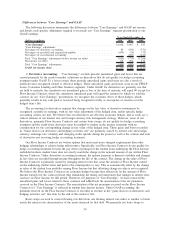
Income from Continuing Operations before Income Tax Expense.
Income from continuing operations before income tax expense for the year ended December 31, 2009
increased $842 million from the prior year. The $842 million increase was primarily due to an increase in
gains on debt repurchases of $472 million and an increase in gains on sales of loans and securities of
$470 million offset by an increase of $159 million in net losses on derivative and hedging activities.
The primary contributors to each of the identified drivers of changes in income from continuing
operations before income tax expense for the year-over-year period are as follows:
• Net interest income after provisions for loan losses decreased by $41 million in the year ended
December 31, 2009 from the prior year. This decrease was due to a $399 million increase in provisions
for loan losses partially offset by a $358 million increase in net interest income. The increase in net
interest income was primarily due to an increase in the FFELP Loans net interest margin primarily due
to an increase in Gross Floor Income and the impact of derivative accounting and a $15 billion increase
in the average balance of GAAP-basis student loans. The increase in provisions for loan losses related
primarily to increases in charge-off expectations on Private Education Loans primarily as a result of the
continued weakening of the U.S. economy.
• Securitization servicing and Residual Interest revenue increased by $33 million from the prior year
primarily due to a $95 million decrease in the current-year unrealized mark-to-market loss on our Residual
Interests compared with the prior year, partially offset by a decrease in net Embedded Floor value.
33