Sallie Mae 2010 Annual Report Download - page 204
Download and view the complete annual report
Please find page 204 of the 2010 Sallie Mae annual report below. You can navigate through the pages in the report by either clicking on the pages listed below, or by using the keyword search tool below to find specific information within the annual report.-
 1
1 -
2
-
3
-
4
-
5
-
6
-
7
-
8
-
9
-
10
-
11
-
12
-
13
-
14
-
15
-
16
-
17
-
18
-
19
-
20
-
21
-
22
-
23
-
24
-
25
-
26
-
27
-
28
-
29
-
30
-
31
-
32
-
33
-
34
-
35
-
36
-
37
-
38
-
39
-
40
-
41
-
42
-
43
-
44
-
45
-
46
-
47
-
48
-
49
-
50
-
51
-
52
-
53
-
54
-
55
-
56
-
57
-
58
-
59
-
60
-
61
-
62
-
63
-
64
-
65
-
66
-
67
-
68
-
69
-
70
-
71
-
72
-
73
-
74
-
75
-
76
-
77
-
78
-
79
-
80
-
81
-
82
-
83
-
84
-
85
-
86
-
87
-
88
-
89
-
90
-
91
-
92
-
93
-
94
-
95
-
96
-
97
-
98
-
99
-
100
-
101
-
102
-
103
-
104
-
105
-
106
-
107
-
108
-
109
-
110
-
111
-
112
-
113
-
114
-
115
-
116
-
117
-
118
-
119
-
120
-
121
-
122
-
123
-
124
-
125
-
126
-
127
-
128
-
129
-
130
-
131
-
132
-
133
-
134
-
135
-
136
-
137
-
138
-
139
-
140
-
141
-
142
-
143
-
144
-
145
-
146
-
147
-
148
-
149
-
150
-
151
-
152
-
153
-
154
-
155
-
156
-
157
-
158
-
159
-
160
-
161
-
162
-
163
-
164
-
165
-
166
-
167
-
168
-
169
-
170
-
171
-
172
-
173
-
174
-
175
-
176
-
177
-
178
-
179
-
180
-
181
-
182
-
183
-
184
-
185
-
186
-
187
-
188
-
189
-
190
-
191
-
192
-
193
-
 194
194 -
 195
195 -
 196
196 -
 197
197 -
 198
198 -
 199
199 -
 200
200 -
 201
201 -
 202
202 -
 203
203 -
 204
204 -
 205
205 -
 206
206 -
 207
207 -
 208
208 -
 209
209 -
 210
210 -
 211
211 -
 212
212 -
 213
213 -
 214
214 -
215
-
216
-
217
-
218
-
219
-
220
-
221
-
222
-
223
-
224
-
225
-
226
 |
 |

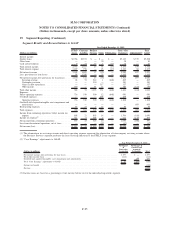
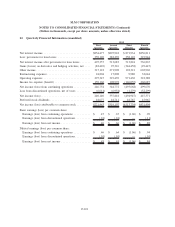
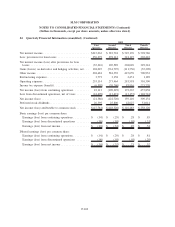
22. Quarterly Financial Information (unaudited)
First
Quarter
Second
Quarter
Third
Quarter
Fourth
Quarter
2010
Net interest income .............................. $854,477 $895,922 $ 871,934 $856,811
Less: provisions for loan losses ..................... 359,120 382,239 358,110 319,944
Net interest income after provisions for loan losses ....... 495,357 513,683 513,824 536,867
Gains (losses) on derivative and hedging activities, net .... (82,410) 95,316 (344,458) (29,447)
Other income ................................... 315,118 271,998 192,321 603,969
Restructuring expenses ............................ 24,804 17,808 9,980 32,644
Operating expenses .............................. 297,347 319,439 971,430 318,388
Income tax expense (benefit) ....................... 159,160 198,978 (126,055) 260,687
Net income (loss) from continuing operations ........... 246,754 344,772 (493,668) 499,670
Loss from discontinued operations, net of taxes ......... (6,614) (6,954) (1,279) (52,299)
Net income (loss)................................ 240,140 337,818 (494,947) 447,371
Preferred stock dividends .......................... 18,677 18,711 18,787 15,967
Net income (loss) attributable to common stock ......... $221,463 $319,107 $(513,734) $431,404
Basic earnings (loss) per common share:
Earnings (loss) from continuing operations ........... $ .47 $ .67 $ (1.06) $ .99
Earnings (loss) from discontinued operations .......... (.01) (.01) — (.11)
Earnings (loss) from net income ................... $ .46 $ .66 $ (1.06) $ .88
Diluted earnings (loss) per common share:
Earnings (loss) from continuing operations ........... $ .46 $ .64 $ (1.06) $ .94
Earnings (loss) from discontinued operations .......... (.01) (.01) — (.10)
Earnings (loss) from net income ................... $ .45 $ .63 $ (1.06) $ .84
F-101
SLM CORPORATION
NOTES TO CONSOLIDATED FINANCIAL STATEMENTS (Continued)
(Dollars in thousands, except per share amounts, unless otherwise stated)