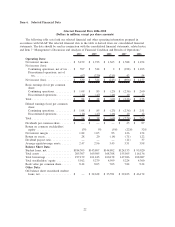
Sallie Mae 2010 Annual Report Download - page 29
Download and view the complete annual report
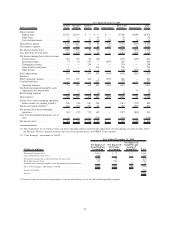
Please find page 29 of the 2010 Sallie Mae annual report below. You can navigate through the pages in the report by either clicking on the pages listed below, or by using the keyword search tool below to find specific information within the annual report.-
 1
1 -
2
-
3
-
4
-
5
-
6
-
7
-
8
-
9
-
10
-
11
-
12
-
13
-
14
-
15
-
16
-
17
-
18
-
 19
19 -
 20
20 -
 21
21 -
 22
22 -
 23
23 -
 24
24 -
 25
25 -
 26
26 -
 27
27 -
 28
28 -
 29
29 -
 30
30 -
 31
31 -
 32
32 -
 33
33 -
 34
34 -
 35
35 -
 36
36 -
 37
37 -
 38
38 -
 39
39 -
40
-
41
-
42
-
43
-
44
-
45
-
46
-
47
-
48
-
49
-
50
-
51
-
52
-
53
-
54
-
55
-
56
-
57
-
58
-
59
-
60
-
61
-
62
-
63
-
64
-
65
-
66
-
67
-
68
-
69
-
70
-
71
-
72
-
73
-
74
-
75
-
76
-
77
-
78
-
79
-
80
-
81
-
82
-
83
-
84
-
85
-
86
-
87
-
88
-
89
-
90
-
91
-
92
-
93
-
94
-
95
-
96
-
97
-
98
-
99
-
100
-
101
-
102
-
103
-
104
-
105
-
106
-
107
-
108
-
109
-
110
-
111
-
112
-
113
-
114
-
115
-
116
-
117
-
118
-
119
-
120
-
121
-
122
-
123
-
124
-
125
-
126
-
127
-
128
-
129
-
130
-
131
-
132
-
133
-
134
-
135
-
136
-
137
-
138
-
139
-
140
-
141
-
142
-
143
-
144
-
145
-
146
-
147
-
148
-
149
-
150
-
151
-
152
-
153
-
154
-
155
-
156
-
157
-
158
-
159
-
160
-
161
-
162
-
163
-
164
-
165
-
166
-
167
-
168
-
169
-
170
-
171
-
172
-
173
-
174
-
175
-
176
-
177
-
178
-
179
-
180
-
181
-
182
-
183
-
184
-
185
-
186
-
187
-
188
-
189
-
190
-
191
-
192
-
193
-
194
-
195
-
196
-
197
-
198
-
199
-
200
-
201
-
202
-
203
-
204
-
205
-
206
-
207
-
208
-
209
-
210
-
211
-
212
-
213
-
214
-
215
-
216
-
217
-
218
-
219
-
220
-
221
-
222
-
223
-
224
-
225
-
226
 |
 |
and the term asset-backed securities market to re-finance both FFELP and Private Education Loans. We
believe that conditions in these markets have improved as compared to last year and are conducive to funding
at more favorable spreads and advance rates. Retail Bank deposits are also expected to continue to be a source
of funding at favorable rates. We currently expect our net interest margins in the coming year to be stable in
both our FFELP Loans and Consumer Lending segments.
2011 Management Objectives
In 2011 we have set out five major goals to create shareholder value. They are: (1) Reduce our operating
expenses; (2) Maximize cash flows from FFELP Loans; (3) Prudently grow Consumer Lending segment assets
and revenue; (4) Increase Business Services segment revenue; and (5) Reinstate dividends and/or share
repurchases. Here is how we plan to achieve these objectives.
Reduce Operating Expenses
The elimination of FFELP by HCERA greatly reduced the scope of our historical revenue generating
capabilities. In 2010 we originated $14 billion of loans, 84 percent of them FFELP Loans; in 2011 we expect
to originate $2.5 billion of new loans, all of them Private Education Loans. Our FFELP related revenues will
decline over the coming years. As a result, we must effectively match our cost structure to our ongoing
business. Operating expenses will be reduced company wide. We have set a goal of getting to an annualized
operating expense quarterly run rate of $250 million by the fourth quarter of 2011.
Maximize Cash Flows from FFELP Loans
We have a $148.6 billion portfolio of FFELP Loans that is expected to generate significant amounts of
cash flow and earnings in the coming years. We plan to reduce related costs, minimize income volatility and
opportunistically purchase other FFELP Loan portfolios like we did with SLC.
Grow Consumer Lending Segment Assets and Revenue
Successfully growing Private Education Loan lending is the key component of our long-term plan to grow
shareholder value. We must originate increasing numbers of high quality Private Education Loans, increase net
interest margins and further reduce charge-offs and provision for loan losses. To manage our borrowing costs,
we must achieve more attractive term asset-backed securities market access and prices in the coming year.
Increase Business Services Segment Revenue
Our Business Services segment is comprised of several businesses with customers related to FFELP that
will experience revenue declines and several businesses with customers that provide growth opportunities. Our
growth businesses are ED servicing, ED collections, other school-based asset type servicing and collections,
Campus Payment Solutions, transaction processing and 529 college-savings plan account asset servicing. We
currently have a 22 percent market share of the ED Servicing Contract. This volume will grow organically as
more loans are originated under DL. Our goal is to further expand our market share and broaden the services
we provide to ED and other third party servicing clients. The ED collection contract will also grow organically
as more loans are originated under DL. We also seek to increase our market share through improved
performance. Campus Payment Solutions is a business line that we expect to grow by expanding our product
offerings and leveraging our deep relationships with colleges and universities. Assets under management in
529 college-savings plans total $34.5 billion and have been growing at a rate of 21 percent over the last three
years. Our goal is to service additional 529 plans.
Reinstate Dividends and/or Share Repurchases
We suspended our dividend and share repurchase programs in April 2007 and have not since reinstated
these programs. We now believe that our cash flow and capital positions have strengthened sufficiently that by
28