Sallie Mae 2010 Annual Report Download - page 192
Download and view the complete annual report
Please find page 192 of the 2010 Sallie Mae annual report below. You can navigate through the pages in the report by either clicking on the pages listed below, or by using the keyword search tool below to find specific information within the annual report.-
 1
1 -
2
-
3
-
4
-
5
-
6
-
7
-
8
-
9
-
10
-
11
-
12
-
13
-
14
-
15
-
16
-
17
-
18
-
19
-
20
-
21
-
22
-
23
-
24
-
25
-
26
-
27
-
28
-
29
-
30
-
31
-
32
-
33
-
34
-
35
-
36
-
37
-
38
-
39
-
40
-
41
-
42
-
43
-
44
-
45
-
46
-
47
-
48
-
49
-
50
-
51
-
52
-
53
-
54
-
55
-
56
-
57
-
58
-
59
-
60
-
61
-
62
-
63
-
64
-
65
-
66
-
67
-
68
-
69
-
70
-
71
-
72
-
73
-
74
-
75
-
76
-
77
-
78
-
79
-
80
-
81
-
82
-
83
-
84
-
85
-
86
-
87
-
88
-
89
-
90
-
91
-
92
-
93
-
94
-
95
-
96
-
97
-
98
-
99
-
100
-
101
-
102
-
103
-
104
-
105
-
106
-
107
-
108
-
109
-
110
-
111
-
112
-
113
-
114
-
115
-
116
-
117
-
118
-
119
-
120
-
121
-
122
-
123
-
124
-
125
-
126
-
127
-
128
-
129
-
130
-
131
-
132
-
133
-
134
-
135
-
136
-
137
-
138
-
139
-
140
-
141
-
142
-
143
-
144
-
145
-
146
-
147
-
148
-
149
-
150
-
151
-
152
-
153
-
154
-
155
-
156
-
157
-
158
-
159
-
160
-
161
-
162
-
163
-
164
-
165
-
166
-
167
-
168
-
169
-
170
-
171
-
172
-
173
-
174
-
175
-
176
-
177
-
178
-
179
-
180
-
181
-
 182
182 -
 183
183 -
 184
184 -
 185
185 -
 186
186 -
 187
187 -
 188
188 -
 189
189 -
 190
190 -
 191
191 -
 192
192 -
 193
193 -
 194
194 -
 195
195 -
 196
196 -
 197
197 -
 198
198 -
 199
199 -
 200
200 -
 201
201 -
 202
202 -
203
-
204
-
205
-
206
-
207
-
208
-
209
-
210
-
211
-
212
-
213
-
214
-
215
-
216
-
217
-
218
-
219
-
220
-
221
-
222
-
223
-
224
-
225
-
226
 |
 |

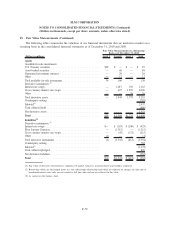
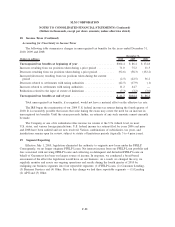
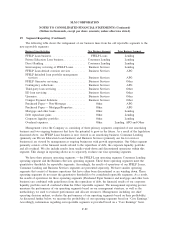
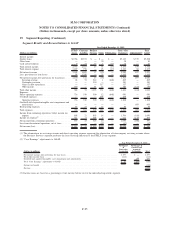
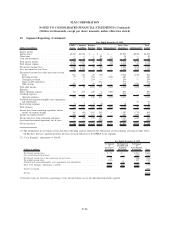
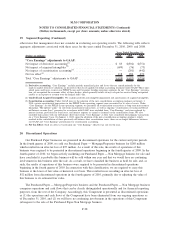
19. Segment Reporting (Continued)
The following table shows the realignment of our business lines from the old reportable segments to the
new reportable segments:
Business Lines/Activities New Business Segment Prior Business Segment
FFELP Loan business. . . ................... FFELP Loans Lending
Private Education Loan business .............. Consumer Lending Lending
Direct Banking........................... Consumer Lending Lending
Intercompany servicing of FFELP Loans........ Business Services Lending
FFELP Loan default aversion services ......... Business Services APG
FFELP defaulted loan portfolio management
services .............................. Business Services APG
FFELP Guarantor servicing ................. Business Services Other
Contingency collections . ................... Business Services APG
Third-party loan servicing .................. Business Services Other
ED loan servicing ........................ Business Services Other
Upromise ............................... Business Services Other
Campus Payment Solutions ................. Business Services Other
Purchased Paper — Non-Mortgage ............ Other APG
Purchased Paper — Mortgage/Properties ........ Other APG
Mortgage and other loans ................... Other Lending
Debt repurchase gains . . ................... Other Lending
Corporate liquidity portfolio ................. Other Lending
Overhead expenses ........................ Other Lending, APG and Other
Management views the Company as consisting of three primary segments comprised of one amortizing
business and two ongoing businesses that have the potential to grow in the future. As a result of the legislation
discussed above, our FFELP Loan business is now viewed as an amortizing business. Consumer Lending
(primarily our Private Education Loan business) and Business Services (primarily our fee-for-services
businesses) are viewed by management as ongoing businesses with growth opportunities. Our Other segment
primarily consists of the financial results related to the repurchase of debt, the corporate liquidity portfolio
and all overhead. We also include results from smaller wind-down and discontinued operations within this
segment. This change in reporting allows us to separately evaluate our four operating segments.
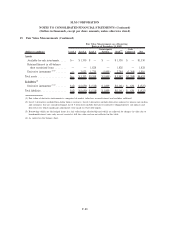
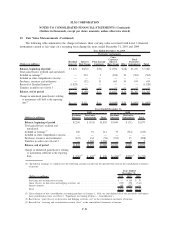
We have three primary operating segments — the FFELP Loan operating segment, Consumer Lending
operating segment and the Business Services operating segment. These three operating segments meet the
quantitative thresholds for reportable segments. Accordingly, the results of operations of our FFELP Loans,
Consumer Lending and Business Services segments are presented separately. We have smaller operating
segments that consist of business operations that have either been discontinued or are winding down. These
operating segments do not meet the quantitative thresholds to be considered reportable segments. As a result,
the results of operations for these operating segments (Purchased Paper business and mortgage and other loan
business) are combined with gains/losses from the repurchase of debt, the financial results of our corporate
liquidity portfolio and all overhead within the Other reportable segment. The management reporting process
measures the performance of our operating segments based on our management structure, as well as the
methodology we used to evaluate performance and allocate resources. Management, including our chief
operating decision makers, evaluates the performance of our operating segments based on their profitability.
As discussed further below, we measure the profitability of our operating segments based on “Core Earnings.”
Accordingly, information regarding our reportable segments is provided based on a “Core Earnings” basis.
F-89
SLM CORPORATION
NOTES TO CONSOLIDATED FINANCIAL STATEMENTS (Continued)
(Dollars in thousands, except per share amounts, unless otherwise stated)