Sallie Mae 2010 Annual Report Download - page 6
Download and view the complete annual report
Please find page 6 of the 2010 Sallie Mae annual report below. You can navigate through the pages in the report by either clicking on the pages listed below, or by using the keyword search tool below to find specific information within the annual report.-
 1
1 -
 2
2 -
 3
3 -
 4
4 -
 5
5 -
 6
6 -
 7
7 -
 8
8 -
 9
9 -
 10
10 -
 11
11 -
 12
12 -
 13
13 -
 14
14 -
 15
15 -
 16
16 -
 17
17 -
18
-
19
-
20
-
21
-
22
-
23
-
24
-
25
-
26
-
27
-
28
-
29
-
30
-
31
-
32
-
33
-
34
-
35
-
36
-
37
-
38
-
39
-
40
-
41
-
42
-
43
-
44
-
45
-
46
-
47
-
48
-
49
-
50
-
51
-
52
-
53
-
54
-
55
-
56
-
57
-
58
-
59
-
60
-
61
-
62
-
63
-
64
-
65
-
66
-
67
-
68
-
69
-
70
-
71
-
72
-
73
-
74
-
75
-
76
-
77
-
78
-
79
-
80
-
81
-
82
-
83
-
84
-
85
-
86
-
87
-
88
-
89
-
90
-
91
-
92
-
93
-
94
-
95
-
96
-
97
-
98
-
99
-
100
-
101
-
102
-
103
-
104
-
105
-
106
-
107
-
108
-
109
-
110
-
111
-
112
-
113
-
114
-
115
-
116
-
117
-
118
-
119
-
120
-
121
-
122
-
123
-
124
-
125
-
126
-
127
-
128
-
129
-
130
-
131
-
132
-
133
-
134
-
135
-
136
-
137
-
138
-
139
-
140
-
141
-
142
-
143
-
144
-
145
-
146
-
147
-
148
-
149
-
150
-
151
-
152
-
153
-
154
-
155
-
156
-
157
-
158
-
159
-
160
-
161
-
162
-
163
-
164
-
165
-
166
-
167
-
168
-
169
-
170
-
171
-
172
-
173
-
174
-
175
-
176
-
177
-
178
-
179
-
180
-
181
-
182
-
183
-
184
-
185
-
186
-
187
-
188
-
189
-
190
-
191
-
192
-
193
-
194
-
195
-
196
-
197
-
198
-
199
-
200
-
201
-
202
-
203
-
204
-
205
-
206
-
207
-
208
-
209
-
210
-
211
-
212
-
213
-
214
-
215
-
216
-
217
-
218
-
219
-
220
-
221
-
222
-
223
-
224
-
225
-
226
 |
 |
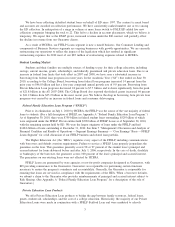
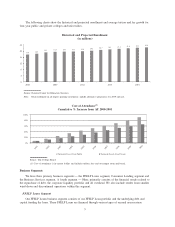
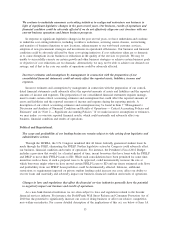
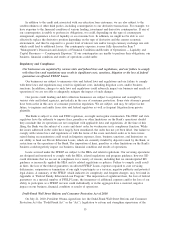
The following charts show the historical and projected enrollment and average tuition and fee growth for
four-year public and private colleges and universities.
Historical and Projected Enrollment
(in millions)
17.8 18.2
19.1 19.5 19.6 19.7 19.9 20.2 20.7 21.1 21.4 21.8 22.1 22.4
20
24
12
16
4
8
0
2006 2009 2012 2015 2018
Source: National Center for Education Statistics
Note: Total enrollment in all degree-granting institutions; middle alternative projections for 2009 onward.
Cost of Attendance
(1)
Cumulative % Increase from AY 2000-2001
0%
20%
40%
60%
80%
100%
Tuition & Fees 4-Year Public Tuition & Fees 4-Year Private
Source: The College Board
(1) Cost of attendance is in current dollars and includes tuition, fees and on-campus room and board.
Business Segments
We have three primary business segments — the FFELP Loans segment, Consumer Lending segment and
the Business Services segment. A fourth segment — Other, primarily consists of the financial results related to
the repurchase of debt, the corporate liquidity portfolio and all overhead. We also include results from smaller
wind-down and discontinued operations within this segment.
FFELP Loans Segment
Our FFELP Loans business segment consists of our FFELP Loan portfolio and the underlying debt and
capital funding the loans. These FFELP Loans are financed through various types of secured non-recourse
5