Sallie Mae 2010 Annual Report Download - page 42
Download and view the complete annual report
Please find page 42 of the 2010 Sallie Mae annual report below. You can navigate through the pages in the report by either clicking on the pages listed below, or by using the keyword search tool below to find specific information within the annual report.-
 1
1 -
2
-
3
-
4
-
5
-
6
-
7
-
8
-
9
-
10
-
11
-
12
-
13
-
14
-
15
-
16
-
17
-
18
-
19
-
20
-
21
-
22
-
23
-
24
-
25
-
26
-
27
-
28
-
29
-
30
-
31
-
 32
32 -
 33
33 -
 34
34 -
 35
35 -
 36
36 -
 37
37 -
 38
38 -
 39
39 -
 40
40 -
 41
41 -
 42
42 -
 43
43 -
 44
44 -
 45
45 -
 46
46 -
 47
47 -
 48
48 -
 49
49 -
 50
50 -
 51
51 -
 52
52 -
53
-
54
-
55
-
56
-
57
-
58
-
59
-
60
-
61
-
62
-
63
-
64
-
65
-
66
-
67
-
68
-
69
-
70
-
71
-
72
-
73
-
74
-
75
-
76
-
77
-
78
-
79
-
80
-
81
-
82
-
83
-
84
-
85
-
86
-
87
-
88
-
89
-
90
-
91
-
92
-
93
-
94
-
95
-
96
-
97
-
98
-
99
-
100
-
101
-
102
-
103
-
104
-
105
-
106
-
107
-
108
-
109
-
110
-
111
-
112
-
113
-
114
-
115
-
116
-
117
-
118
-
119
-
120
-
121
-
122
-
123
-
124
-
125
-
126
-
127
-
128
-
129
-
130
-
131
-
132
-
133
-
134
-
135
-
136
-
137
-
138
-
139
-
140
-
141
-
142
-
143
-
144
-
145
-
146
-
147
-
148
-
149
-
150
-
151
-
152
-
153
-
154
-
155
-
156
-
157
-
158
-
159
-
160
-
161
-
162
-
163
-
164
-
165
-
166
-
167
-
168
-
169
-
170
-
171
-
172
-
173
-
174
-
175
-
176
-
177
-
178
-
179
-
180
-
181
-
182
-
183
-
184
-
185
-
186
-
187
-
188
-
189
-
190
-
191
-
192
-
193
-
194
-
195
-
196
-
197
-
198
-
199
-
200
-
201
-
202
-
203
-
204
-
205
-
206
-
207
-
208
-
209
-
210
-
211
-
212
-
213
-
214
-
215
-
216
-
217
-
218
-
219
-
220
-
221
-
222
-
223
-
224
-
225
-
226
 |
 |

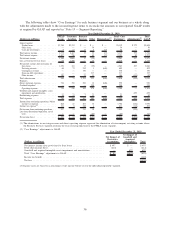
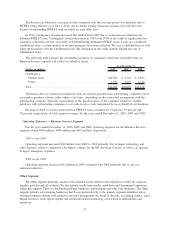
(1) “Unrealized gains (losses) on derivative and hedging activities, net” comprises the following unrealized mark-to-market gains (losses):
(Dollars in millions) 2010 2009 2008
Years Ended
December 31,
Floor Income Contracts . . . . . . . . . . . . . . . . . . . . . . . . . . . . . . . . . . . . . . . . . . . . $156 $ 483 $(529)
Basis swaps . . . . . . . . . . . . . . . . . . . . . . . . . . . . . . . . . . . . . . . . . . . . . . . . . . . . 341 (413) (239)
Foreign currency hedges . . . . . . . . . . . . . . . . . . . . . . . . . . . . . . . . . . . . . . . . . . . . (83) (255) 328
Other . . . . . . . . . . . . . . . . . . . . . . . . . . . . . . . . . . . . . . . . . . . . . . . . . . . . . . . . . 40 (97) (112)
Total unrealized gains (losses) on derivative and hedging activities, net . . . . . . . . . . . $454 $(282) $(552)
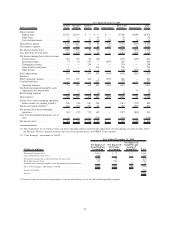
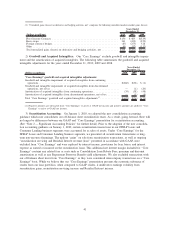
2) Goodwill and Acquired Intangibles: Our “Core Earnings” exclude goodwill and intangible impair-
ment and the amortization of acquired intangibles. The following table summarizes the goodwill and acquired
intangible adjustments for the years ended December 31, 2010, 2009 and 2008.
(Dollars in millions) 2010 2009 2008
Years Ended
December 31,
“Core Earnings” goodwill and acquired intangibles adjustments:
Goodwill and intangible impairment of acquired intangibles from continuing
operations . . . . . . . . . . . . . . . . . . . . . . . . . . . . . . . . . . . . . . . . . . . . . . . . . . . . . . $(660) $(36) $ (1)
Goodwill and intangible impairment of acquired intangibles from discontinued
operations, net of tax . . . . . . . . . . . . . . . . . . . . . . . . . . . . . . . . . . . . . . . . . . . . . . — (1) (20)
Amortization of acquired intangibles from continuing operations. . . . . . . . . . . . . . . . . . (39) (38) (48)
Amortization of acquired intangibles from discontinued operations, net of tax . . . . . . . . — (1) (4)
Total “Core Earnings” goodwill and acquired intangibles adjustments
(1)
............. $(699) $(76) $(73)
(1) Negative amounts are subtracted from “Core Earnings” to arrive at GAAP net income and positive amounts are added to “Core
Earnings” to arrive at GAAP net income.
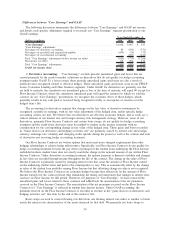
3) Securitization Accounting: On January 1, 2010, we adopted the new consolidation accounting
guidance which now consolidates our off-balance sheet securitization trusts. As a result, going forward, there will
no longer be differences between our GAAP and “Core Earnings” presentation for securitization accounting.
(See “Note 2 — Significant Accounting Policies” for further detail). Prior to the adoption of the new consolida-
tion accounting guidance on January 1, 2010, certain securitization transactions in our FFELP Loans and
Consumer Lending business segments were accounted for as sales of assets. Under “Core Earnings” for the
FFELP Loans and Consumer Lending business segments, we presented all securitization transactions as long-
term non-recourse financings. The upfront “gains” on sale from securitization transactions, as well as ongoing
“securitization servicing and Residual Interest revenue (loss)” presented in accordance with GAAP, were
excluded from “Core Earnings” and were replaced by interest income, provisions for loan losses, and interest
expense as earned or incurred on the securitization loans. This additional net interest margin included for “Core
Earnings” contains any related fees or costs such as Consolidation Loan Rebate Fees, premium and discount
amortization as well as any Repayment Borrower Benefit yield adjustments. We also excluded transactions with
our off-balance sheet trusts from “Core Earnings” as they were considered intercompany transactions on a “Core
Earnings” basis. While we believe that our “Core Earnings” presentation presents the economic substance of
results from our loan portfolios, when compared to GAAP results, it understates earnings volatility from
securitization gains, securitization servicing income and Residual Interest income.
41