Sallie Mae 2010 Annual Report Download - page 202
Download and view the complete annual report
Please find page 202 of the 2010 Sallie Mae annual report below. You can navigate through the pages in the report by either clicking on the pages listed below, or by using the keyword search tool below to find specific information within the annual report.-
 1
1 -
2
-
3
-
4
-
5
-
6
-
7
-
8
-
9
-
10
-
11
-
12
-
13
-
14
-
15
-
16
-
17
-
18
-
19
-
20
-
21
-
22
-
23
-
24
-
25
-
26
-
27
-
28
-
29
-
30
-
31
-
32
-
33
-
34
-
35
-
36
-
37
-
38
-
39
-
40
-
41
-
42
-
43
-
44
-
45
-
46
-
47
-
48
-
49
-
50
-
51
-
52
-
53
-
54
-
55
-
56
-
57
-
58
-
59
-
60
-
61
-
62
-
63
-
64
-
65
-
66
-
67
-
68
-
69
-
70
-
71
-
72
-
73
-
74
-
75
-
76
-
77
-
78
-
79
-
80
-
81
-
82
-
83
-
84
-
85
-
86
-
87
-
88
-
89
-
90
-
91
-
92
-
93
-
94
-
95
-
96
-
97
-
98
-
99
-
100
-
101
-
102
-
103
-
104
-
105
-
106
-
107
-
108
-
109
-
110
-
111
-
112
-
113
-
114
-
115
-
116
-
117
-
118
-
119
-
120
-
121
-
122
-
123
-
124
-
125
-
126
-
127
-
128
-
129
-
130
-
131
-
132
-
133
-
134
-
135
-
136
-
137
-
138
-
139
-
140
-
141
-
142
-
143
-
144
-
145
-
146
-
147
-
148
-
149
-
150
-
151
-
152
-
153
-
154
-
155
-
156
-
157
-
158
-
159
-
160
-
161
-
162
-
163
-
164
-
165
-
166
-
167
-
168
-
169
-
170
-
171
-
172
-
173
-
174
-
175
-
176
-
177
-
178
-
179
-
180
-
181
-
182
-
183
-
184
-
185
-
186
-
187
-
188
-
189
-
190
-
191
-
 192
192 -
 193
193 -
 194
194 -
 195
195 -
 196
196 -
 197
197 -
 198
198 -
 199
199 -
 200
200 -
 201
201 -
 202
202 -
 203
203 -
 204
204 -
 205
205 -
 206
206 -
 207
207 -
 208
208 -
 209
209 -
 210
210 -
 211
211 -
 212
212 -
213
-
214
-
215
-
216
-
217
-
218
-
219
-
220
-
221
-
222
-
223
-
224
-
225
-
226
 |
 |

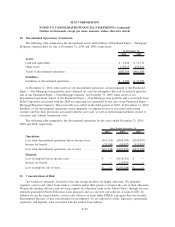
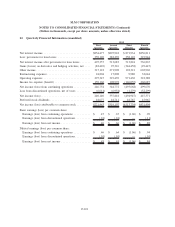
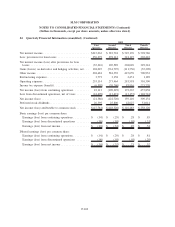
20. Discontinued Operations (Continued)
The following table summarizes the discontinued assets and liabilities of Purchased Paper — Mortgage/
Properties business held for sale at December 31, 2010 and 2009, respectively.
2010 2009
At December 31,
Assets:
Cash and equivalents.......................................... $ 3,848 $ 11,570
Other assets ................................................ 176,916 450,410
Assets of discontinued operations ................................ $180,764 $461,980
Liabilities:
Liabilities of discontinued operations .............................. $ 6,300 $ 31,500
At December 31, 2010, other assets of our discontinued operations consist primarily of the Purchased
Paper — Non Mortgage loan portfolio and a deferred tax asset for intangibles that will be realized upon the
sale of our Purchased Paper — Non Mortgage business. At December 31, 2009, other assets of our
discontinued operations consist of the Purchased Paper — Non Mortgage loan portfolio and a receivable from
SLM Corporation associated with the 2009 net operating loss generated by the sale of our Purchased Paper —
Mortgage/Properties business. This receivable was settled in the third quarter of 2010. At December 31, 2010,
liabilities of our discontinued operations consist primarily of estimated reserves associated with certain
recourse and buy-back provisions associated with the asset sale, as well as restructuring liabilities related to
severance and contract termination costs.
The following table summarizes the discontinued operations for the years ended December 31, 2010,
2009 and 2008, respectively.
2010 2009 2008
Years Ended December 31,
Operations:
Loss from discontinued operations before income taxes ...... $(91,516) $(304,769) $(345,987)
Income tax benefit ................................. (24,368) (84,897) (130,881)
Loss from discontinued operations, net of taxes ........... $(67,148) $(219,872) $(215,106)
Disposal:
Loss on disposal before income taxes ................... $ — $(118,761) $ —
Income tax benefit ................................. — (23,053) —
Loss on disposal, net of taxes ......................... $ — $ (95,708) $ —
21. Concentrations of Risk
Our business is primarily focused in loan and savings products for higher education. We primarily
originate, service and collect loans made to students and/or their parents to finance the cost of their education.
We provide funding, delivery and servicing support for education loans in the United States, through our non-
federally guaranteed Private Education Loan programs and as a servicer and collector of loans for ED. In
addition we are the largest holder, servicer and collector of loans under FFELP, a program that was recently
discontinued. Because of this concentration in one industry, we are exposed to credit, legislative, operational,
regulatory, and liquidity risks associated with the student loan industry.
F-99
SLM CORPORATION
NOTES TO CONSOLIDATED FINANCIAL STATEMENTS (Continued)
(Dollars in thousands, except per share amounts, unless otherwise stated)